Delta Airlines 2009 Annual Report Download - page 164
Download and view the complete annual report
Please find page 164 of the 2009 Delta Airlines annual report below. You can navigate through the pages in the report by either clicking on the pages listed below, or by using the keyword search tool below to find specific information within the annual report.-
 1
1 -
2
-
3
-
4
-
5
-
6
-
7
-
8
-
9
-
10
-
11
-
12
-
13
-
14
-
15
-
16
-
17
-
18
-
19
-
20
-
21
-
22
-
23
-
24
-
25
-
26
-
27
-
28
-
29
-
30
-
31
-
32
-
33
-
34
-
35
-
36
-
37
-
38
-
39
-
40
-
41
-
42
-
43
-
44
-
45
-
46
-
47
-
48
-
49
-
50
-
51
-
52
-
53
-
54
-
55
-
56
-
57
-
58
-
59
-
60
-
61
-
62
-
63
-
64
-
65
-
66
-
67
-
68
-
69
-
70
-
71
-
72
-
73
-
74
-
75
-
76
-
77
-
78
-
79
-
80
-
81
-
82
-
83
-
84
-
85
-
86
-
87
-
88
-
89
-
90
-
91
-
92
-
93
-
94
-
95
-
96
-
97
-
98
-
99
-
100
-
101
-
102
-
103
-
104
-
105
-
106
-
107
-
108
-
109
-
110
-
111
-
112
-
113
-
114
-
115
-
116
-
117
-
118
-
119
-
120
-
121
-
122
-
123
-
124
-
125
-
126
-
127
-
128
-
129
-
130
-
131
-
132
-
133
-
134
-
135
-
136
-
137
-
138
-
139
-
140
-
141
-
142
-
143
-
144
-
145
-
146
-
147
-
148
-
149
-
150
-
151
-
152
-
153
-
 154
154 -
 155
155 -
 156
156 -
 157
157 -
 158
158 -
 159
159 -
 160
160 -
 161
161 -
 162
162 -
 163
163 -
 164
164 -
 165
165 -
 166
166 -
 167
167 -
 168
168 -
 169
169 -
 170
170 -
 171
171 -
 172
172 -
 173
173 -
 174
174 -
175
-
176
-
177
-
178
-
179
 |
 |

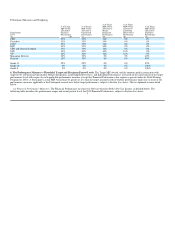
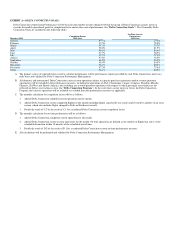
Threshold Target Maximum
% of Target Financial Performance Measure Paid 50% 100% 200%
Required 2010 Pre-Tax Income $328 million $489 million $650 million
Payouts will be straight-line interpolated when Pre-Tax Income results fall above Threshold and below Target or above Target and below Maximum.
"Pre-Tax Income" will be the amount of Pre-Tax Income, if any, determined under the Profit Sharing Program for 2010.2
(b) Operational Performance Measures. The Operational Performance measures for 2010 are based on both Delta and Delta Connection operational
performance, with (i) Delta's operational performance accounting for 75% of the measure and (ii) Delta Connection performance accounting for 25% of the
measure. Delta's Operational Performance is based on the number of times during 2010 that Delta meets or exceeds its monthly goals under the broad-based
employee shared rewards program (the "Shared Rewards Program"). Delta Connection's Operational Performance is based on the number of times during
2010 that the Delta Connection carriers meet or exceed their monthly operational goals for (x) completion factor and (y) on-time performance (the "Delta
Connection Goals"). The Delta Connection Goals and the methodology for determining whether these goals are met are described in Exhibit A hereto. The
following table describes the performance ranges and award payout levels for 2010 Operational Performance, subject to Section 4(c) above:
2 The Profit Sharing Program for 2010 defines "Pre-Tax Income" as follows: for any calendar year, the Company's consolidated pre-tax income
calculated in accordance with Generally Accepted Accounting Principles in the United States and as reported in the Company's public securities filings
but excluding: (a) all asset write downs related to long term assets, (b) gains or losses with respect to employee equity securities, (c) gains or losses with
respect to extraordinary, one-time or non-recurring events (including without limitation one-time transition or integration costs incurred in connection
with the merger of the Company and Northwest Airlines Corporation during the two year period following the merger), and (d) expense accrued with
respect to the profit sharing plan. 4