Delta Airlines 2009 Annual Report Download - page 114
Download and view the complete annual report
Please find page 114 of the 2009 Delta Airlines annual report below. You can navigate through the pages in the report by either clicking on the pages listed below, or by using the keyword search tool below to find specific information within the annual report.-
 1
1 -
2
-
3
-
4
-
5
-
6
-
7
-
8
-
9
-
10
-
11
-
12
-
13
-
14
-
15
-
16
-
17
-
18
-
19
-
20
-
21
-
22
-
23
-
24
-
25
-
26
-
27
-
28
-
29
-
30
-
31
-
32
-
33
-
34
-
35
-
36
-
37
-
38
-
39
-
40
-
41
-
42
-
43
-
44
-
45
-
46
-
47
-
48
-
49
-
50
-
51
-
52
-
53
-
54
-
55
-
56
-
57
-
58
-
59
-
60
-
61
-
62
-
63
-
64
-
65
-
66
-
67
-
68
-
69
-
70
-
71
-
72
-
73
-
74
-
75
-
76
-
77
-
78
-
79
-
80
-
81
-
82
-
83
-
84
-
85
-
86
-
87
-
88
-
89
-
90
-
91
-
92
-
93
-
94
-
95
-
96
-
97
-
98
-
99
-
100
-
101
-
102
-
103
-
 104
104 -
 105
105 -
 106
106 -
 107
107 -
 108
108 -
 109
109 -
 110
110 -
 111
111 -
 112
112 -
 113
113 -
 114
114 -
 115
115 -
 116
116 -
 117
117 -
 118
118 -
 119
119 -
 120
120 -
 121
121 -
 122
122 -
 123
123 -
 124
124 -
125
-
126
-
127
-
128
-
129
-
130
-
131
-
132
-
133
-
134
-
135
-
136
-
137
-
138
-
139
-
140
-
141
-
142
-
143
-
144
-
145
-
146
-
147
-
148
-
149
-
150
-
151
-
152
-
153
-
154
-
155
-
156
-
157
-
158
-
159
-
160
-
161
-
162
-
163
-
164
-
165
-
166
-
167
-
168
-
169
-
170
-
171
-
172
-
173
-
174
-
175
-
176
-
177
-
178
-
179
 |
 |
Table of Contents
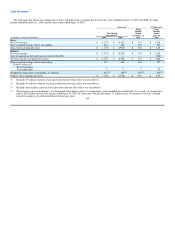
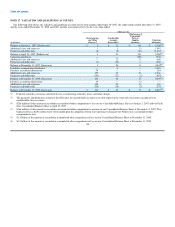
The following table shows our computation of basic and diluted (loss) earnings per share for the years ended December 31, 2009 and 2008, the eight
months ended December 31, 2007 and the four months ended April 30, 2007:
Successor Predecessor
Eight Four
Months Months
Year Ended Ended Ended
December 31, December 31, April 30,
(in millions, except per share data) 2009 2008 2007 2007
Basic:
Net (loss) income $ (1,237) $ (8,922) $ 314 $ 1,298
Basic weighted average shares outstanding 827 468 394 197
Basic (loss) earnings per share $ (1.50) $ (19.08) $ 0.80 $ 6.58
Diluted:
Net (loss) income $ (1,237) $ (8,922) $ 314 $ 1,298
Gain recognized on the forgiveness of convertible debt — — — (216)
Net (loss) income assuming conversion $ (1,237) $ (8,922) $ 314 $ 1,082
Basic weighted average shares outstanding 827 468 394 197
Dilutive effects of:
Restricted shares — — 1 —
Convertible debt — — — 37
Weighted average shares outstanding, as adjusted 827(1) 468(2) 395(3) 234(4)
Dilutive (loss) earnings per share $ (1.50) $ (19.08) $ 0.79 $ 4.63
(1) Excludes 35 million common stock equivalents because their effect was anti-dilutive.
(2) Excludes 41 million common stock equivalents because their effect was anti-dilutive.
(3) Excludes nine million common stock equivalents because their effect was anti-dilutive.
(4) Upon emergence from bankruptcy, we discharged our liabilities subject to compromise, which included convertible debt. As a result, we recognized a
gain of $216 million for the four months ended April 30, 2007. In connection with this discharge, 37 million shares of common stock were assumed
issued for purposes of calculating diluted earnings per share. 109