Delta Airlines 2009 Annual Report Download - page 39
Download and view the complete annual report
Please find page 39 of the 2009 Delta Airlines annual report below. You can navigate through the pages in the report by either clicking on the pages listed below, or by using the keyword search tool below to find specific information within the annual report.-
 1
1 -
2
-
3
-
4
-
5
-
6
-
7
-
8
-
9
-
10
-
11
-
12
-
13
-
14
-
15
-
16
-
17
-
18
-
19
-
20
-
21
-
22
-
23
-
24
-
25
-
26
-
27
-
28
-
 29
29 -
 30
30 -
 31
31 -
 32
32 -
 33
33 -
 34
34 -
 35
35 -
 36
36 -
 37
37 -
 38
38 -
 39
39 -
 40
40 -
 41
41 -
 42
42 -
 43
43 -
 44
44 -
 45
45 -
 46
46 -
 47
47 -
 48
48 -
 49
49 -
50
-
51
-
52
-
53
-
54
-
55
-
56
-
57
-
58
-
59
-
60
-
61
-
62
-
63
-
64
-
65
-
66
-
67
-
68
-
69
-
70
-
71
-
72
-
73
-
74
-
75
-
76
-
77
-
78
-
79
-
80
-
81
-
82
-
83
-
84
-
85
-
86
-
87
-
88
-
89
-
90
-
91
-
92
-
93
-
94
-
95
-
96
-
97
-
98
-
99
-
100
-
101
-
102
-
103
-
104
-
105
-
106
-
107
-
108
-
109
-
110
-
111
-
112
-
113
-
114
-
115
-
116
-
117
-
118
-
119
-
120
-
121
-
122
-
123
-
124
-
125
-
126
-
127
-
128
-
129
-
130
-
131
-
132
-
133
-
134
-
135
-
136
-
137
-
138
-
139
-
140
-
141
-
142
-
143
-
144
-
145
-
146
-
147
-
148
-
149
-
150
-
151
-
152
-
153
-
154
-
155
-
156
-
157
-
158
-
159
-
160
-
161
-
162
-
163
-
164
-
165
-
166
-
167
-
168
-
169
-
170
-
171
-
172
-
173
-
174
-
175
-
176
-
177
-
178
-
179
 |
 |

Table of Contents
Results of Operations—2008 GAAP Compared to 2007 Predecessor plus Successor
In September 2005, we and substantially all of our subsidiaries (the "Delta Debtors") filed voluntary petitions for reorganization under Chapter 11 of the
U.S. Bankruptcy Code. On April 30, 2007 (the "Effective Date"), the Delta Debtors emerged from bankruptcy. References in this Form 10-K to "Successor"
refer to Delta on or after May 1, 2007, after giving effect to (1) the cancellation of Delta common stock issued prior to the Effective Date; (2) the issuance of
new Delta common stock and certain debt securities in accordance with the Delta Debtors' Joint Plan of Reorganization ("Delta's Plan of Reorganization");
and (3) the application of fresh start reporting. References to "Predecessor" refer to Delta prior to May 1, 2007.
We adopted fresh start reporting upon emergence from Chapter 11, which resulted in our becoming a new entity for financial reporting purposes. Due to
our adoption of fresh start reporting on April 30, 2007, the accompanying Consolidated Statements of Operations for 2007 include the results of operations for
(1) the four months ended April 30, 2007 of the Predecessor and (2) the eight months ended December 31, 2007 of the Successor.
In this section, we added the results of operations for the four months ended April 30, 2007 of the Predecessor with the eight months ended December 31,
2007 of the Successor. We then compared (1) Delta's results of operations for the year ended December 31, 2008 under GAAP with (2) the 2007 Predecessor
plus Successor results. We believe this presentation of the 2007 financial results provides a more meaningful basis for comparing Delta's financial
performance in 2008 and 2007.
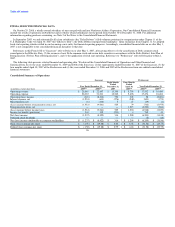
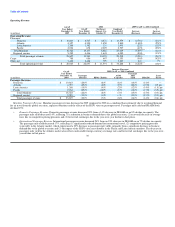
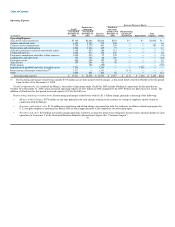
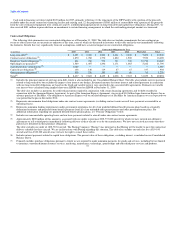
Operating Revenue
GAAP
Predecessor +
Successor
Increase due
to Northwest Increase
Operations (Decrease)
Year Ended Year Ended October 30 to Excluding
December 31, December 31, December 31, Northwest
(in millions) 2008 2007 Increase 2008 Operations
Operating Revenue:
Passenger:
Mainline $ 15,137 $ 12,758 $ 2,379 $ 1,396 $ 983
Regional carriers 4,446 4,170 276 334 (58)
Total passenger revenue 19,583 16,928 2,655 1,730 925
Cargo 686 482 204 96 108
Other, net 2,428 1,744 684 199 485
Total operating revenue $ 22,697 $ 19,154 $ 3,543 $ 2,025 $ 1,518
Northwest Operations. As a result of the Merger, our results of operations under GAAP for 2008 include Northwest's operations for the period from
October 30 to December 31, 2008, which increased our operating revenue by $2.0 billion in 2008 compared to the 2007 Predecessor plus Successor results.
The addition of Northwest to our operations for that period increased ASMs, or capacity, 10% for the full year.
34