Delta Airlines 2009 Annual Report Download - page 35
Download and view the complete annual report
Please find page 35 of the 2009 Delta Airlines annual report below. You can navigate through the pages in the report by either clicking on the pages listed below, or by using the keyword search tool below to find specific information within the annual report.-
 1
1 -
2
-
3
-
4
-
5
-
6
-
7
-
8
-
9
-
10
-
11
-
12
-
13
-
14
-
15
-
16
-
17
-
18
-
19
-
20
-
21
-
22
-
23
-
24
-
 25
25 -
 26
26 -
 27
27 -
 28
28 -
 29
29 -
 30
30 -
 31
31 -
 32
32 -
 33
33 -
 34
34 -
 35
35 -
 36
36 -
 37
37 -
 38
38 -
 39
39 -
 40
40 -
 41
41 -
 42
42 -
 43
43 -
 44
44 -
 45
45 -
46
-
47
-
48
-
49
-
50
-
51
-
52
-
53
-
54
-
55
-
56
-
57
-
58
-
59
-
60
-
61
-
62
-
63
-
64
-
65
-
66
-
67
-
68
-
69
-
70
-
71
-
72
-
73
-
74
-
75
-
76
-
77
-
78
-
79
-
80
-
81
-
82
-
83
-
84
-
85
-
86
-
87
-
88
-
89
-
90
-
91
-
92
-
93
-
94
-
95
-
96
-
97
-
98
-
99
-
100
-
101
-
102
-
103
-
104
-
105
-
106
-
107
-
108
-
109
-
110
-
111
-
112
-
113
-
114
-
115
-
116
-
117
-
118
-
119
-
120
-
121
-
122
-
123
-
124
-
125
-
126
-
127
-
128
-
129
-
130
-
131
-
132
-
133
-
134
-
135
-
136
-
137
-
138
-
139
-
140
-
141
-
142
-
143
-
144
-
145
-
146
-
147
-
148
-
149
-
150
-
151
-
152
-
153
-
154
-
155
-
156
-
157
-
158
-
159
-
160
-
161
-
162
-
163
-
164
-
165
-
166
-
167
-
168
-
169
-
170
-
171
-
172
-
173
-
174
-
175
-
176
-
177
-
178
-
179
 |
 |

Table of Contents
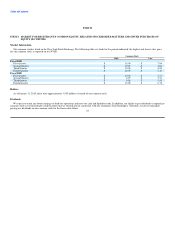
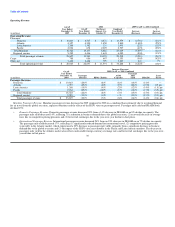
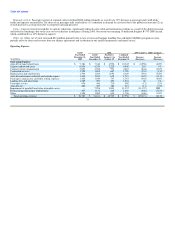
Operating Revenue
2008 2009 GAAP vs. 2008 Combined
GAAP
Year Ended GAAP Northwest Combined %
December 31, Year Ended January 1 to Year Ended Increase Increase
(in millions) 2009 December 31 October 29 December 31 (Decrease) (Decrease)
Operating Revenue:
Passenger:
Domestic $ 10,863 $ 8,707 $ 4,872 $ 13,579 $ (2,716) (20)%
Atlantic 4,357 4,390 1,450 5,840 (1,483) (25)%
Latin America 1,268 1,362 131 1,493 (225) (15)%
Pacific 2,034 678 2,029 2,707 (673) (25)%
Total Mainline 18,522 15,137 8,482 23,619 (5,097) (22)%
Regional carriers 5,285 4,446 1,643 6,089 (804) (13)%
Total passenger revenue 23,807 19,583 10,125 29,708 (5,901) (20)%
Cargo 788 686 667 1,353 (565) (42)%
Other, net 3,468 2,428 799 3,227 241 7%
Total operating revenue $ 28,063 $ 22,697 $ 11,591 $ 34,288 $ (6,225) (18)%
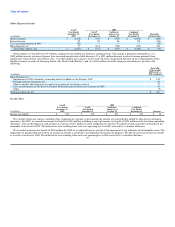
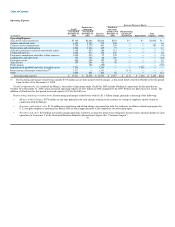
Increase (Decrease)
2009 GAAP vs. 2008 Combined
GAAP
Year Ended Passenger
December 31, Passenger ASMs Mile Load
(in millions) 2009 Revenue RPMs (Traffic) (Capacity) Yield PRASM Factor
Passenger Revenue:
Domestic $ 10,863 (20)% (8)% (8)% (14)% (14)% —
Atlantic 4,357 (25)% (8)% (9)% (20)% (19)% 0.9 pts
Latin America 1,268 (15)% (4)% (2)% (12)% (14)% (1.5) pts
Pacific 2,034 (25)% (12)% (8)% (14)% (17)% (3.5) pts
Total Mainline 18,522 (22)% (8)% (7)% (15)% (15)% (0.3) pts
Regional carriers 5,285 (13)% (1)% —% (13)% (13)% (0.1) pts
Total passenger revenue $ 23,807 (20)% (7)% (6)% (14)% (14)% (0.4) pts
Mainline Passenger Revenue. Mainline passenger revenue decreased in 2009 compared to 2008 on a combined basis primarily due to weakened demand
for air travel from the global recession, capacity reductions and the effects of the H1N1 virus on passenger travel. Passenger mile yield and PRASM both
declined 15%.
• Domestic Passenger Revenue. Domestic passenger revenue decreased 20% from a 14% decrease in PRASM on an 8% decline in capacity. The
passenger mile yield decreased 14%, reflecting (1) a reduction in business demand due to the global recession, (2) an overall decrease in average
fares due to competitive pricing pressures and (3) lower fuel surcharges due to the year-over-year decline in fuel prices.
• International Passenger Revenue. International passenger revenue decreased 24% from an 18% decrease in PRASM on an 7% decline in capacity.
The passenger mile yield decreased 17%, reflecting (1) significantly reduced demand for international travel, (2) competitive pricing pressures
(especially in the Atlantic market, which experienced a 20% decrease in passenger mile yield), primarily from a significant decrease in business
demand due to the global recession and (3) the impact of the H1N1 virus, most notably in the Pacific and Latin America markets. The decrease in
passenger mile yield in the Atlantic market also reflects unfavorable foreign currency exchange rates and lower fuel surcharges due to the year-over-
year decline in fuel prices. 30