Delta Airlines 2009 Annual Report Download - page 76
Download and view the complete annual report
Please find page 76 of the 2009 Delta Airlines annual report below. You can navigate through the pages in the report by either clicking on the pages listed below, or by using the keyword search tool below to find specific information within the annual report.-
 1
1 -
2
-
3
-
4
-
5
-
6
-
7
-
8
-
9
-
10
-
11
-
12
-
13
-
14
-
15
-
16
-
17
-
18
-
19
-
20
-
21
-
22
-
23
-
24
-
25
-
26
-
27
-
28
-
29
-
30
-
31
-
32
-
33
-
34
-
35
-
36
-
37
-
38
-
39
-
40
-
41
-
42
-
43
-
44
-
45
-
46
-
47
-
48
-
49
-
50
-
51
-
52
-
53
-
54
-
55
-
56
-
57
-
58
-
59
-
60
-
61
-
62
-
63
-
64
-
65
-
 66
66 -
 67
67 -
 68
68 -
 69
69 -
 70
70 -
 71
71 -
 72
72 -
 73
73 -
 74
74 -
 75
75 -
 76
76 -
 77
77 -
 78
78 -
 79
79 -
 80
80 -
 81
81 -
 82
82 -
 83
83 -
 84
84 -
 85
85 -
 86
86 -
87
-
88
-
89
-
90
-
91
-
92
-
93
-
94
-
95
-
96
-
97
-
98
-
99
-
100
-
101
-
102
-
103
-
104
-
105
-
106
-
107
-
108
-
109
-
110
-
111
-
112
-
113
-
114
-
115
-
116
-
117
-
118
-
119
-
120
-
121
-
122
-
123
-
124
-
125
-
126
-
127
-
128
-
129
-
130
-
131
-
132
-
133
-
134
-
135
-
136
-
137
-
138
-
139
-
140
-
141
-
142
-
143
-
144
-
145
-
146
-
147
-
148
-
149
-
150
-
151
-
152
-
153
-
154
-
155
-
156
-
157
-
158
-
159
-
160
-
161
-
162
-
163
-
164
-
165
-
166
-
167
-
168
-
169
-
170
-
171
-
172
-
173
-
174
-
175
-
176
-
177
-
178
-
179
 |
 |
Table of Contents
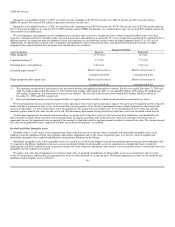
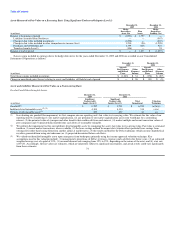
Year Ended
December 31,
(in millions, except per share data) 2008(1)(2) 2007
Operating revenue $34,288 $ 31,781
Net (loss) income (14,706) 601
Basic and diluted (loss) earnings per share (18.13) 0.74
(1) Includes a $1.1 billion one-time primarily non-cash charge related to the issuance or vesting of employee equity awards in connection with the Merger.
(2) Includes $11.6 billion in non-cash charges from impairments of goodwill and other intangible assets for Delta and Northwest prior to the Closing Date.
For additional information, see Note 5.
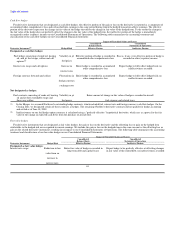
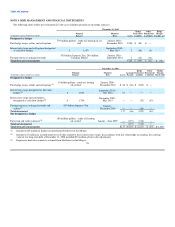
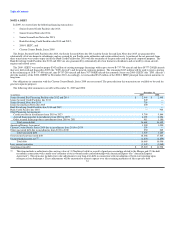
NOTE 3. FAIR VALUE MEASUREMENTS
Fair value is defined as an exit price, representing the amount that would be received to sell an asset or paid to transfer a liability in an orderly transaction
between market participants. Fair value is a market-based measurement that is determined based on assumptions that market participants would use in pricing
an asset or liability. A three-tier fair value hierarchy is used to prioritize the inputs in measuring fair value as follows:
• Level 1. Observable inputs such as quoted prices in active markets;
• Level 2. Inputs, other than quoted prices in active markets, that are observable either directly or indirectly; and
• Level 3. Unobservable inputs in which there is little or no market data, which require the reporting entity to develop its own assumptions.
Assets and liabilities measured at fair value are based on one or more of three valuation techniques identified in the tables below. Where more than one
technique is noted, individual assets or liabilities were valued using one or more of the noted techniques. The valuation techniques are as follows:
(a) Market approach. Prices and other relevant information generated by market transactions involving identical or comparable assets or liabilities;
(b) Cost approach. Amount that would be required to replace the service capacity of an asset (replacement cost); and
(c) Income approach. Techniques to convert future amounts to a single present amount based on market expectations (including present value
techniques, option-pricing and excess earnings models).
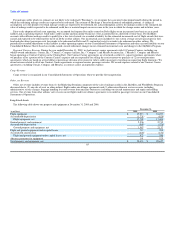
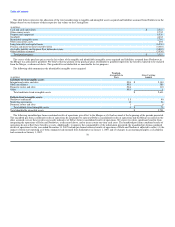
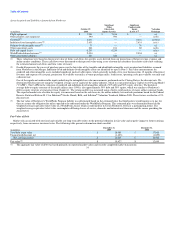
Assets and Liabilities Measured at Fair Value on a Recurring Basis
Significant
Quoted Other Significant
Prices In Observable Unobservable
December 31, Active Markets Inputs Inputs Valuation
(in millions) 2009 (Level 1) (Level 2) (Level 3) Technique
Cash equivalents $ 4,335 $ 4,335 $ — $ — (a)
Short-term investments 71 — — 71 (c)
Restricted cash equivalents 435 435 — — (a)
Long-term investments 129 — — 129 (c)
Hedge derivatives asset, net 108 — 108 — (a)(c)
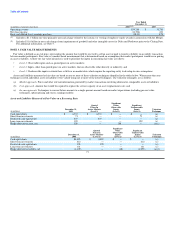
Significant
Quoted Other Significant
Prices In Observable Unobservable
December 31, Active Markets Inputs Inputs Valuation
(in millions) 2008 (Level 1) (Level 2) (Level 3) Technique
Cash equivalents $4,020 $ 4,020 $ — $ — (a)
Short-term investments 212 — — 212 (c)
Restricted cash equivalents 128 128 — — (a)
Long-term investments 121 — — 121 (c)
Hedge derivatives liability, net (1,109) — (18) (1,091) (a)(c)
71