Delta Airlines 2009 Annual Report Download - page 78
Download and view the complete annual report
Please find page 78 of the 2009 Delta Airlines annual report below. You can navigate through the pages in the report by either clicking on the pages listed below, or by using the keyword search tool below to find specific information within the annual report.-
 1
1 -
2
-
3
-
4
-
5
-
6
-
7
-
8
-
9
-
10
-
11
-
12
-
13
-
14
-
15
-
16
-
17
-
18
-
19
-
20
-
21
-
22
-
23
-
24
-
25
-
26
-
27
-
28
-
29
-
30
-
31
-
32
-
33
-
34
-
35
-
36
-
37
-
38
-
39
-
40
-
41
-
42
-
43
-
44
-
45
-
46
-
47
-
48
-
49
-
50
-
51
-
52
-
53
-
54
-
55
-
56
-
57
-
58
-
59
-
60
-
61
-
62
-
63
-
64
-
65
-
66
-
67
-
 68
68 -
 69
69 -
 70
70 -
 71
71 -
 72
72 -
 73
73 -
 74
74 -
 75
75 -
 76
76 -
 77
77 -
 78
78 -
 79
79 -
 80
80 -
 81
81 -
 82
82 -
 83
83 -
 84
84 -
 85
85 -
 86
86 -
 87
87 -
 88
88 -
89
-
90
-
91
-
92
-
93
-
94
-
95
-
96
-
97
-
98
-
99
-
100
-
101
-
102
-
103
-
104
-
105
-
106
-
107
-
108
-
109
-
110
-
111
-
112
-
113
-
114
-
115
-
116
-
117
-
118
-
119
-
120
-
121
-
122
-
123
-
124
-
125
-
126
-
127
-
128
-
129
-
130
-
131
-
132
-
133
-
134
-
135
-
136
-
137
-
138
-
139
-
140
-
141
-
142
-
143
-
144
-
145
-
146
-
147
-
148
-
149
-
150
-
151
-
152
-
153
-
154
-
155
-
156
-
157
-
158
-
159
-
160
-
161
-
162
-
163
-
164
-
165
-
166
-
167
-
168
-
169
-
170
-
171
-
172
-
173
-
174
-
175
-
176
-
177
-
178
-
179
 |
 |

Table of Contents
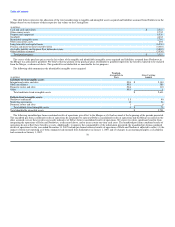
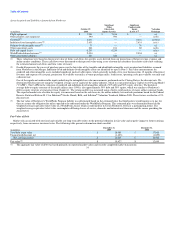
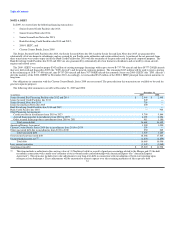
• Foreign Currency Derivatives. Our foreign currency derivative instruments consist of Japanese yen and Canadian dollar forward and collar contracts
and are valued based on data readily observable in public markets.
Plan Assets
Significant
Quoted Other Significant
Prices In Observable Unobservable
December 31, Active Markets Inputs Inputs Valuation
(in millions) 2009 (Level 1) (Level 2) (Level 3) Technique
Common stock
U.S. $ 1,661 $ 1,661 $ — $ — (a)
Non-U.S. 842 842 — — (a)
Mutual funds
U.S. 851 2 849 — (a)
Non-U.S. 251 — 251 — (a)
Non-U.S. emerging markets 335 55 280 — (a)
Diversified fixed income 310 — 310 — (a)
High yield 317 — 271 46 (a)(c)
Commingled funds
U.S. 891 — 891 — (a)
Non-U.S. 187 — 187 — (a)
Non-U.S. emerging markets 86 — 86 — (a)
Diversified fixed income 346 — 346 — (a)
High yield 50 — 50 — (a)
Alternative investments
Limited partnerships 1,251 — — 1,251 (a)(c)
Real estate and natural resources 336 — — 336 (a)(c)
Fixed income 389 — 389 — (a)(c)
Cash equivalents and other 649 43 606 — (a)
Total plan assets $ 8,752 $ 2,603 $ 4,516 $ 1,633
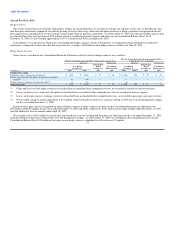
Common Stock. Common stock is valued at the closing price reported on the active market on which the individual securities are traded.
Mutual and Commingled Funds. These funds are valued using the net asset value, which is based on quoted market prices of the underlying assets owned
by the fund minus its liabilities and then divided by the number of shares outstanding.
Alternative Investments. The valuation of alternative investments requires significant judgment due to the absence of quoted market prices, the inherent
lack of liquidity and the long-term nature of such assets; therefore these assets are generally classified in Level 3. Alternative investments include limited
partnerships, real estate, oil and gas and timberland. Investments are valued based upon recommendations of our investment managers. The investment
managers' values are from valuation models where one or more of the significant inputs into the model cannot be observed and which require the development
of relevant assumptions. We also assess the potential for adjustment to the fair value of these investments due to the lag in the availability of data. In these
cases, we solicit preliminary valuation updates at year-end from the investment managers and use that information and corroborating data from public markets
to determine any needed adjustments to fair value.
Fixed Income. Investments include corporate bonds, government bonds, collateralized mortgage obligations, and other asset backed securities. These
investments are generally valued at the bid price or the average of the bid and asked price. Prices are obtained from independent pricing services and are based
on pricing models, quoted prices of securities with similar characteristics, or broker quotes.
Cash Equivalents and Other. These investments primarily consist of short term investment funds, which are valued using the net asset value based on the
value of the underlying assets minus the liabilities and then divided by the number of shares outstanding. Cash is not included in the table above.
73