Delta Airlines 2009 Annual Report Download - page 36
Download and view the complete annual report
Please find page 36 of the 2009 Delta Airlines annual report below. You can navigate through the pages in the report by either clicking on the pages listed below, or by using the keyword search tool below to find specific information within the annual report.-
 1
1 -
2
-
3
-
4
-
5
-
6
-
7
-
8
-
9
-
10
-
11
-
12
-
13
-
14
-
15
-
16
-
17
-
18
-
19
-
20
-
21
-
22
-
23
-
24
-
25
-
 26
26 -
 27
27 -
 28
28 -
 29
29 -
 30
30 -
 31
31 -
 32
32 -
 33
33 -
 34
34 -
 35
35 -
 36
36 -
 37
37 -
 38
38 -
 39
39 -
 40
40 -
 41
41 -
 42
42 -
 43
43 -
 44
44 -
 45
45 -
 46
46 -
47
-
48
-
49
-
50
-
51
-
52
-
53
-
54
-
55
-
56
-
57
-
58
-
59
-
60
-
61
-
62
-
63
-
64
-
65
-
66
-
67
-
68
-
69
-
70
-
71
-
72
-
73
-
74
-
75
-
76
-
77
-
78
-
79
-
80
-
81
-
82
-
83
-
84
-
85
-
86
-
87
-
88
-
89
-
90
-
91
-
92
-
93
-
94
-
95
-
96
-
97
-
98
-
99
-
100
-
101
-
102
-
103
-
104
-
105
-
106
-
107
-
108
-
109
-
110
-
111
-
112
-
113
-
114
-
115
-
116
-
117
-
118
-
119
-
120
-
121
-
122
-
123
-
124
-
125
-
126
-
127
-
128
-
129
-
130
-
131
-
132
-
133
-
134
-
135
-
136
-
137
-
138
-
139
-
140
-
141
-
142
-
143
-
144
-
145
-
146
-
147
-
148
-
149
-
150
-
151
-
152
-
153
-
154
-
155
-
156
-
157
-
158
-
159
-
160
-
161
-
162
-
163
-
164
-
165
-
166
-
167
-
168
-
169
-
170
-
171
-
172
-
173
-
174
-
175
-
176
-
177
-
178
-
179
 |
 |
Table of Contents
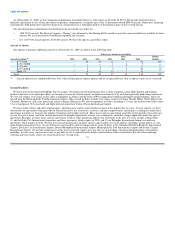
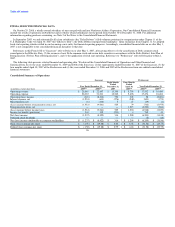
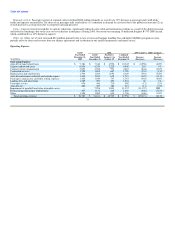
Regional carriers. Passenger revenue of regional carriers declined $804 million primarily as a result of a 13% decrease in passenger mile yield while
traffic and capacity remained flat. The decrease in passenger mile yield reflects (1) a reduction in demand for air travel due to the global recession and (2) an
overall decrease in average fares due to competitive pricing pressures.
Cargo. Cargo revenue decreased due to capacity reductions, significantly reduced cargo yields and international volume as a result of the global recession,
and lower fuel surcharges due to the year-over-year decline in fuel prices. During 2009, we retired our remaining 10 dedicated freighter B-747-200F aircraft,
which contributed to a 40% decline in capacity.
Other, net. Other, net revenue increased $241 million primarily due to new or increased baggage handling fees and higher SkyMiles program revenue,
partially offset by decreased revenue from our alliance agreements and a reduction in our aircraft maintenance and repair service.
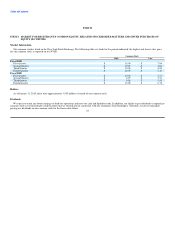
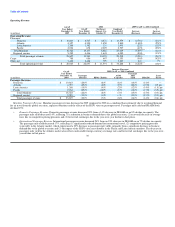
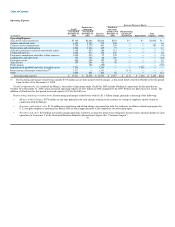
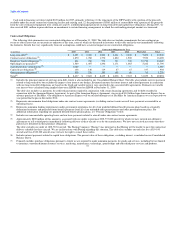
Operating Expense
2008 2009 GAAP vs. 2008 Combined
GAAP
Year Ended GAAP Northwest Combined %
December 31, Year Ended January 1 to Year Ended Increase Increase
(in millions) 2009 December 31 October 29 December 31 (Decrease) (Decrease)
Operating Expense:
Aircraft fuel and related taxes $ 7,384 $ 7,346 $ 4,996 $ 12,342 $ (4,958) (40)%
Salaries and related costs 6,838 4,329 2,220 6,549 289 4%
Contract carrier arrangements 3,823 3,766 901 4,667 (844) (18)%
Contracted services 1,595 1,062 667 1,729 (134) (8)%
Depreciation and amortization 1,536 1,266 1,054 2,320 (784) (34)%
Aircraft maintenance materials and outside repairs 1,434 1,169 612 1,781 (347) (19)%
Passenger commissions and other selling expenses 1,405 1,030 737 1,767 (362) (20)%
Landing fees and other rents 1,289 787 456 1,243 46 4%
Passenger service 638 440 210 650 (12) (2)%
Aircraft rent 480 307 184 491 (11) (2)%
Impairment of goodwill and other intangible assets — 7,296 3,841 11,137 (11,137) NM
Restructuring and merger-related items 407 1,131 225 1,356 (949) (70)%
Other 1,558 1,082 644 1,726 (168) (10)%
Total operating expense $ 28,387 $ 31,011 $ 16,747 $ 47,758 $ (19,371) (41)%
31