Delta Airlines 2009 Annual Report Download - page 70
Download and view the complete annual report
Please find page 70 of the 2009 Delta Airlines annual report below. You can navigate through the pages in the report by either clicking on the pages listed below, or by using the keyword search tool below to find specific information within the annual report.-
 1
1 -
2
-
3
-
4
-
5
-
6
-
7
-
8
-
9
-
10
-
11
-
12
-
13
-
14
-
15
-
16
-
17
-
18
-
19
-
20
-
21
-
22
-
23
-
24
-
25
-
26
-
27
-
28
-
29
-
30
-
31
-
32
-
33
-
34
-
35
-
36
-
37
-
38
-
39
-
40
-
41
-
42
-
43
-
44
-
45
-
46
-
47
-
48
-
49
-
50
-
51
-
52
-
53
-
54
-
55
-
56
-
57
-
58
-
59
-
 60
60 -
 61
61 -
 62
62 -
 63
63 -
 64
64 -
 65
65 -
 66
66 -
 67
67 -
 68
68 -
 69
69 -
 70
70 -
 71
71 -
 72
72 -
 73
73 -
 74
74 -
 75
75 -
 76
76 -
 77
77 -
 78
78 -
 79
79 -
 80
80 -
81
-
82
-
83
-
84
-
85
-
86
-
87
-
88
-
89
-
90
-
91
-
92
-
93
-
94
-
95
-
96
-
97
-
98
-
99
-
100
-
101
-
102
-
103
-
104
-
105
-
106
-
107
-
108
-
109
-
110
-
111
-
112
-
113
-
114
-
115
-
116
-
117
-
118
-
119
-
120
-
121
-
122
-
123
-
124
-
125
-
126
-
127
-
128
-
129
-
130
-
131
-
132
-
133
-
134
-
135
-
136
-
137
-
138
-
139
-
140
-
141
-
142
-
143
-
144
-
145
-
146
-
147
-
148
-
149
-
150
-
151
-
152
-
153
-
154
-
155
-
156
-
157
-
158
-
159
-
160
-
161
-
162
-
163
-
164
-
165
-
166
-
167
-
168
-
169
-
170
-
171
-
172
-
173
-
174
-
175
-
176
-
177
-
178
-
179
 |
 |
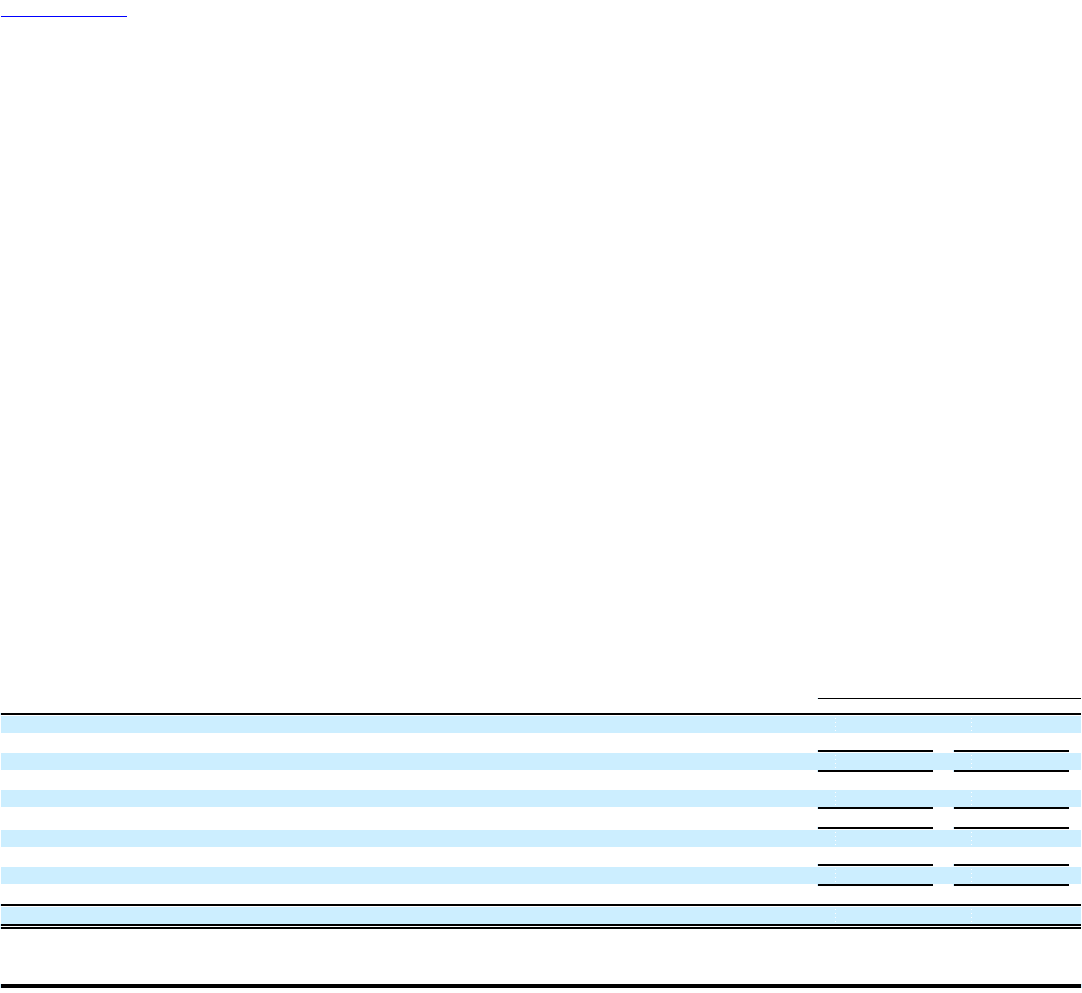
Table of Contents
For mileage credits which we estimate are not likely to be redeemed ("Breakage"), we recognize the associated value proportionally during the period in
which the remaining mileage credits are expected to be redeemed. The estimate of Breakage is based on historical redemption patterns. A change in
assumptions as to the period over which mileage credits are expected to be redeemed, the actual redemption activity for mileage credits or the estimated fair
value of mileage credits expected to be redeemed could have a material impact on our revenue in the year in which the change occurs and in future years.
Prior to the adoption of fresh start reporting, we accounted for frequent flyer miles earned on Delta flights on an incremental cost basis as an accrued
liability and as operating expense, while miles sold to airline and non-airline businesses were accounted for on a deferred revenue basis. For SkyMiles
accounts with sufficient mileage credits to qualify for a free travel award, we recorded a liability for the estimated incremental cost of flight awards that were
earned and expected to be redeemed for travel on Delta or other airlines. Our incremental costs included (1) our system average cost per passenger for fuel,
food and other direct passenger costs for awards to be redeemed on Delta and (2) contractual costs for awards to be redeemed on other airlines. We
periodically recorded adjustments to this liability in other operating expense on our Consolidated Statements of Operations and other accrued liabilities on our
Consolidated Balance Sheets based on awards earned, awards redeemed, changes in our estimated incremental costs and changes to the SkyMiles Program.
Regional Carriers Revenue. During the year ended December 31, 2009, we had contract carrier agreements with 10 Contract Carriers, including our
wholly-owned subsidiaries, Comair, Inc. ("Comair"), Compass Airlines, Inc. ("Compass") and Mesaba Aviation, Inc. ("Mesaba"). Compass and Mesaba
began operating as Contract Carriers on the Closing Date. Our Contract Carrier agreements are structured as either (1) capacity purchase agreements where
we purchase all or a portion of the Contract Carrier's capacity and are responsible for selling the seat inventory we purchase or (2) revenue proration
agreements, which are based on a fixed dollar or percentage division of revenues for tickets sold to passengers traveling on connecting flight itineraries. We
record revenue related to all of our Contract Carrier agreements as regional carriers passenger revenue. We record expenses related to our Contract Carrier
agreements, excluding Comair, Compass and Mesaba, as contract carrier arrangements expense.
Cargo Revenue
Cargo revenue is recognized in our Consolidated Statements of Operations when we provide the transportation.
Other, net Revenue
Other, net revenue includes revenue from (1) the Marketing Premium component of the sale of mileage credits in the SkyMiles and WorldPerks Programs
discussed above, (2) our sale of seats on other airlines' flights under our alliance agreements and (3) other miscellaneous service revenue, including
administrative service charges, baggage handling fees and revenue from ancillary businesses, including our aircraft maintenance and repair and staffing
services. Our revenue from other airlines' sale of seats on our flights under our alliance agreements is recorded in passenger revenue on our Consolidated
Statements of Operations.
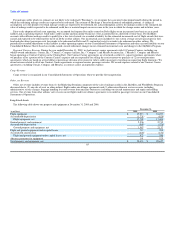
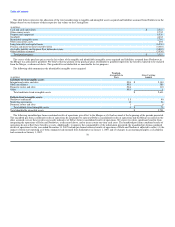
Long-Lived Assets
The following table shows our property and equipment at December 31, 2009 and 2008:
December 31,
(in millions) 2009 2008
Flight equipment $ 19,513 $ 18,237
Accumulated depreciation (1,731) (828)
Flight equipment, net 17,782 17,409
Ground property and equipment 2,936 2,715
Accumulated depreciation (949) (578)
Ground property and equipment, net 1,987 2,137
Flight and ground equipment under capital leases 717 708
Accumulated amortization (244) (152)
Flight and ground equipment under capital leases, net 473 556
Advance payments for equipment 191 525
Total property and equipment, net $ 20,433 $ 20,627
65