Delta Airlines 2009 Annual Report Download - page 163
Download and view the complete annual report
Please find page 163 of the 2009 Delta Airlines annual report below. You can navigate through the pages in the report by either clicking on the pages listed below, or by using the keyword search tool below to find specific information within the annual report.-
 1
1 -
2
-
3
-
4
-
5
-
6
-
7
-
8
-
9
-
10
-
11
-
12
-
13
-
14
-
15
-
16
-
17
-
18
-
19
-
20
-
21
-
22
-
23
-
24
-
25
-
26
-
27
-
28
-
29
-
30
-
31
-
32
-
33
-
34
-
35
-
36
-
37
-
38
-
39
-
40
-
41
-
42
-
43
-
44
-
45
-
46
-
47
-
48
-
49
-
50
-
51
-
52
-
53
-
54
-
55
-
56
-
57
-
58
-
59
-
60
-
61
-
62
-
63
-
64
-
65
-
66
-
67
-
68
-
69
-
70
-
71
-
72
-
73
-
74
-
75
-
76
-
77
-
78
-
79
-
80
-
81
-
82
-
83
-
84
-
85
-
86
-
87
-
88
-
89
-
90
-
91
-
92
-
93
-
94
-
95
-
96
-
97
-
98
-
99
-
100
-
101
-
102
-
103
-
104
-
105
-
106
-
107
-
108
-
109
-
110
-
111
-
112
-
113
-
114
-
115
-
116
-
117
-
118
-
119
-
120
-
121
-
122
-
123
-
124
-
125
-
126
-
127
-
128
-
129
-
130
-
131
-
132
-
133
-
134
-
135
-
136
-
137
-
138
-
139
-
140
-
141
-
142
-
143
-
144
-
145
-
146
-
147
-
148
-
149
-
150
-
151
-
152
-
 153
153 -
 154
154 -
 155
155 -
 156
156 -
 157
157 -
 158
158 -
 159
159 -
 160
160 -
 161
161 -
 162
162 -
 163
163 -
 164
164 -
 165
165 -
 166
166 -
 167
167 -
 168
168 -
 169
169 -
 170
170 -
 171
171 -
 172
172 -
 173
173 -
174
-
175
-
176
-
177
-
178
-
179
 |
 |
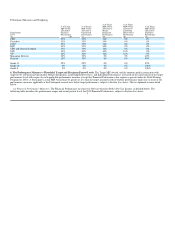
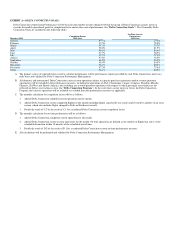
Performance Measures and Weighting
% of Target % of Target
% of Target % of Target MIP Award MIP Award % of Target
MIP Award MIP Award Allocated to allocated to MIP Award
allocated to allocated to Merger Leadership allocated to
Employment Financial Operational Integration Effectiveness Individual
Level Performance Performance Performance Performance Performance
(A) (B) (C) (D) (E) (F)
CEO 33% 33% 34% 0% 0%
President 33% 33% 34% 0% 0%
COO 33% 33% 34% 0% 0%
EVP 33% 33% 34% 0% 0%
CFO and General Counsel 33% 33% 34% 0% 0%
SVP 30% 30% 30% 10% 0%
VP 30% 30% 30% 10% 0%
Managing Director 30% 30% 0% 0% 40%
Director 30% 30% 0% 0% 40%
Grade 11 25% 25% 0% 0% 50%
Grade 10 0% 0% 0% 0% 100%
Grade 8 0% 0% 0% 0% 100%
6. The Performance Measures—Threshold, Target and Maximum Payout Levels. The Target MIP Award, and the amounts paid in connection with
target levels of Financial, Operational, Merger Integration, Leadership Effectiveness, and Individual Performance, are based on the achievement of the target
performance level with respect to each applicable performance measure (except that Financial Performance also requires a payout under the Profit Sharing
Program for 2010). A Participant's actual MIP Award may be greater or less than the target amount based on whether performance under one or more of the
performance measures applicable to the Participant exceeds or is below target performance, subject to Section 4(c) above. This is explained in more detail
below.
(a) Financial Performance Measures. The Financial Performance measures for 2010 are based on Delta's Pre-Tax Income, as defined below. The
following table describes the performance ranges and award payout levels for 2010 Financial Performance, subject to Section 4(c) above:
3