Delta Airlines 2009 Annual Report Download - page 62
Download and view the complete annual report
Please find page 62 of the 2009 Delta Airlines annual report below. You can navigate through the pages in the report by either clicking on the pages listed below, or by using the keyword search tool below to find specific information within the annual report.-
 1
1 -
2
-
3
-
4
-
5
-
6
-
7
-
8
-
9
-
10
-
11
-
12
-
13
-
14
-
15
-
16
-
17
-
18
-
19
-
20
-
21
-
22
-
23
-
24
-
25
-
26
-
27
-
28
-
29
-
30
-
31
-
32
-
33
-
34
-
35
-
36
-
37
-
38
-
39
-
40
-
41
-
42
-
43
-
44
-
45
-
46
-
47
-
48
-
49
-
50
-
51
-
 52
52 -
 53
53 -
 54
54 -
 55
55 -
 56
56 -
 57
57 -
 58
58 -
 59
59 -
 60
60 -
 61
61 -
 62
62 -
 63
63 -
 64
64 -
 65
65 -
 66
66 -
 67
67 -
 68
68 -
 69
69 -
 70
70 -
 71
71 -
 72
72 -
73
-
74
-
75
-
76
-
77
-
78
-
79
-
80
-
81
-
82
-
83
-
84
-
85
-
86
-
87
-
88
-
89
-
90
-
91
-
92
-
93
-
94
-
95
-
96
-
97
-
98
-
99
-
100
-
101
-
102
-
103
-
104
-
105
-
106
-
107
-
108
-
109
-
110
-
111
-
112
-
113
-
114
-
115
-
116
-
117
-
118
-
119
-
120
-
121
-
122
-
123
-
124
-
125
-
126
-
127
-
128
-
129
-
130
-
131
-
132
-
133
-
134
-
135
-
136
-
137
-
138
-
139
-
140
-
141
-
142
-
143
-
144
-
145
-
146
-
147
-
148
-
149
-
150
-
151
-
152
-
153
-
154
-
155
-
156
-
157
-
158
-
159
-
160
-
161
-
162
-
163
-
164
-
165
-
166
-
167
-
168
-
169
-
170
-
171
-
172
-
173
-
174
-
175
-
176
-
177
-
178
-
179
 |
 |

Table of Contents
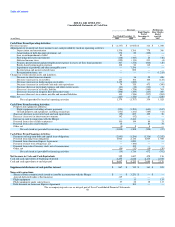
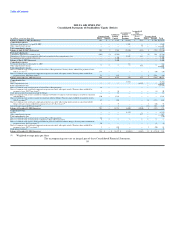
DELTA AIR LINES, INC.
Consolidated Statements of Operations
Successor Predecessor
Eight Months Four Months
Ended Ended
Year Ended December 31, December 31, April 30,
(in millions, except per share data) 2009 2008 2007 2007
Operating Revenue:
Passenger:
Mainline $ 18,522 $ 15,137 $ 8,929 $ 3,829
Regional carriers 5,285 4,446 2,874 1,296
Total passenger revenue 23,807 19,583 11,803 5,125
Cargo 788 686 334 148
Other, net 3,468 2,428 1,221 523
Total operating revenue 28,063 22,697 13,358 5,796
Operating Expense:
Aircraft fuel and related taxes 7,384 7,346 3,416 1,270
Salaries and related costs 6,838 4,329 2,592 1,167
Contract carrier arrangements 3,823 3,766 2,271 1,004
Contracted services 1,595 1,062 611 299
Depreciation and amortization 1,536 1,266 778 386
Aircraft maintenance materials and outside repairs 1,434 1,169 663 320
Passenger commissions and other selling expenses 1,405 1,030 635 298
Landing fees and other rents 1,289 787 475 250
Passenger service 638 440 243 95
Aircraft rent 480 307 156 90
Profit sharing — — 144 14
Impairment of goodwill and other intangible assets — 7,296 — —
Restructuring and merger-related items 407 1,131 — —
Other 1,558 1,082 578 303
Total operating expense 28,387 31,011 12,562 5,496
Operating (Loss) Income (324) (8,314) 796 300
Other (Expense) Income:
Interest expense (contractual interest expense totaled $366 for the four months ended April 30, 2007) (1,278) (705) (390) (262)
Interest income 27 92 114 14
Loss on extinguishment of debt (83) — — —
Miscellaneous, net 77 (114) 5 27
Total other expense, net (1,257) (727) (271) (221)
(Loss) Income Before Reorganization Items, Net (1,581) (9,041) 525 79
Reorganization Items, Net — — — 1,215
(Loss) Income Before Income Taxes (1,581) (9,041) 525 1,294
Income Tax Benefit (Provision) 344 119 (211) 4
Net (Loss) Income $ (1,237) $ (8,922) $ 314 $ 1,298
Basic (Loss) Income per Share $ (1.50) $ (19.08) $ 0.80 $ 6.58
Diluted (Loss) Income per Share $ (1.50) $ (19.08) $ 0.79 $ 4.63
The accompanying notes are an integral part of these Consolidated Financial Statements.
57