Delta Airlines 2009 Annual Report Download - page 102
Download and view the complete annual report
Please find page 102 of the 2009 Delta Airlines annual report below. You can navigate through the pages in the report by either clicking on the pages listed below, or by using the keyword search tool below to find specific information within the annual report.-
 1
1 -
2
-
3
-
4
-
5
-
6
-
7
-
8
-
9
-
10
-
11
-
12
-
13
-
14
-
15
-
16
-
17
-
18
-
19
-
20
-
21
-
22
-
23
-
24
-
25
-
26
-
27
-
28
-
29
-
30
-
31
-
32
-
33
-
34
-
35
-
36
-
37
-
38
-
39
-
40
-
41
-
42
-
43
-
44
-
45
-
46
-
47
-
48
-
49
-
50
-
51
-
52
-
53
-
54
-
55
-
56
-
57
-
58
-
59
-
60
-
61
-
62
-
63
-
64
-
65
-
66
-
67
-
68
-
69
-
70
-
71
-
72
-
73
-
74
-
75
-
76
-
77
-
78
-
79
-
80
-
81
-
82
-
83
-
84
-
85
-
86
-
87
-
88
-
89
-
90
-
91
-
 92
92 -
 93
93 -
 94
94 -
 95
95 -
 96
96 -
 97
97 -
 98
98 -
 99
99 -
 100
100 -
 101
101 -
 102
102 -
 103
103 -
 104
104 -
 105
105 -
 106
106 -
 107
107 -
 108
108 -
 109
109 -
 110
110 -
 111
111 -
 112
112 -
113
-
114
-
115
-
116
-
117
-
118
-
119
-
120
-
121
-
122
-
123
-
124
-
125
-
126
-
127
-
128
-
129
-
130
-
131
-
132
-
133
-
134
-
135
-
136
-
137
-
138
-
139
-
140
-
141
-
142
-
143
-
144
-
145
-
146
-
147
-
148
-
149
-
150
-
151
-
152
-
153
-
154
-
155
-
156
-
157
-
158
-
159
-
160
-
161
-
162
-
163
-
164
-
165
-
166
-
167
-
168
-
169
-
170
-
171
-
172
-
173
-
174
-
175
-
176
-
177
-
178
-
179
 |
 |

Table of Contents
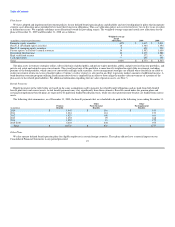
Plan Assets
We have adopted and implemented investment policies for our defined benefit pension plans and disability and survivorship plan for pilots that incorporate
strategic asset allocation mixes intended to best meet their long-term obligations. This asset allocation policy mix is reviewed every two to five years or earlier
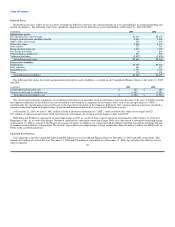
as deemed necessary. We regularly rebalance asset allocations toward the prevailing targets. The weighted-average target and actual asset allocations for the
plans at December 31, 2009 and December 31, 2008 are as follows:
Weighted-Average
Target
(in millions, except target allocations) Allocations 2009 2008
Domestic equity securities 40% $ 3,435 $ 2,831
Non-U.S. developed equity securities 18 1,384 1,354
Non-U.S. emerging equity securities 5 422 222
Private equity / real estate / natural resources 14 1,552 1,605
Diversified fixed income 18 1,372 1,588
High yield fixed income 5 372 413
Cash equivalents — 236 330
Total 100% $ 8,773 $ 8,343
The plan assets investment strategies utilize a diversified mix of global public and private equity portfolios, public and private fixed income portfolios, and
private real estate and natural resource investments. The overall asset mix of the portfolios is more heavily weighted in equity-like investments, including
portions of the bond portfolio, which consist of convertible and high yield securities. Active management strategies are utilized where feasible in an effort to
realize investment returns in excess of market indices. Currency overlay strategy is also used in an effort to generate modest amounts of additional income. A
bond duration extension program utilizing fixed income derivatives is employed in an effort to better align the market value movements of a portion of the
plan assets to the related plan liabilities. For additional information regarding the fair value of pension assets, see Note 3.
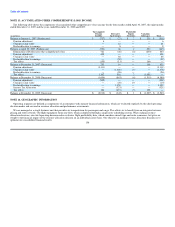
Benefit Payments
Benefit payments in the table below are based on the same assumptions used to measure the related benefit obligations and are paid from both funded
benefit plan trusts and current assets. Actual benefit payments may vary significantly from these estimates. Benefits earned under our pension plans and
certain postemployment benefit plans are expected to be paid from funded benefit plan trusts, while our other postretirement benefits are funded from current
assets.
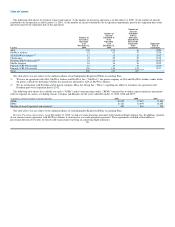
The following table summarizes, as of December 31, 2009, the benefit payments that are scheduled to be paid in the following years ending December 31:
Other Other
Pension Postretirement Postemployment
(in millions) Benefits Benefits Benefits
2010 $ 1,041 $ 116 $ 145
2011 1,016 116 153
2012 1,023 108 161
2013 1,035 99 168
2014 1,052 93 175
2015-2019 5,603 438 975
Total $ 10,770 $ 970 $ 1,777
Other Plans
We also sponsor defined benefit pension plans for eligible employees in certain foreign countries. These plans did not have a material impact on our
Consolidated Financial Statements in any period presented. 97