Delta Airlines 2009 Annual Report Download - page 101
Download and view the complete annual report
Please find page 101 of the 2009 Delta Airlines annual report below. You can navigate through the pages in the report by either clicking on the pages listed below, or by using the keyword search tool below to find specific information within the annual report.-
 1
1 -
2
-
3
-
4
-
5
-
6
-
7
-
8
-
9
-
10
-
11
-
12
-
13
-
14
-
15
-
16
-
17
-
18
-
19
-
20
-
21
-
22
-
23
-
24
-
25
-
26
-
27
-
28
-
29
-
30
-
31
-
32
-
33
-
34
-
35
-
36
-
37
-
38
-
39
-
40
-
41
-
42
-
43
-
44
-
45
-
46
-
47
-
48
-
49
-
50
-
51
-
52
-
53
-
54
-
55
-
56
-
57
-
58
-
59
-
60
-
61
-
62
-
63
-
64
-
65
-
66
-
67
-
68
-
69
-
70
-
71
-
72
-
73
-
74
-
75
-
76
-
77
-
78
-
79
-
80
-
81
-
82
-
83
-
84
-
85
-
86
-
87
-
88
-
89
-
90
-
 91
91 -
 92
92 -
 93
93 -
 94
94 -
 95
95 -
 96
96 -
 97
97 -
 98
98 -
 99
99 -
 100
100 -
 101
101 -
 102
102 -
 103
103 -
 104
104 -
 105
105 -
 106
106 -
 107
107 -
 108
108 -
 109
109 -
 110
110 -
 111
111 -
112
-
113
-
114
-
115
-
116
-
117
-
118
-
119
-
120
-
121
-
122
-
123
-
124
-
125
-
126
-
127
-
128
-
129
-
130
-
131
-
132
-
133
-
134
-
135
-
136
-
137
-
138
-
139
-
140
-
141
-
142
-
143
-
144
-
145
-
146
-
147
-
148
-
149
-
150
-
151
-
152
-
153
-
154
-
155
-
156
-
157
-
158
-
159
-
160
-
161
-
162
-
163
-
164
-
165
-
166
-
167
-
168
-
169
-
170
-
171
-
172
-
173
-
174
-
175
-
176
-
177
-
178
-
179
 |
 |

Table of Contents
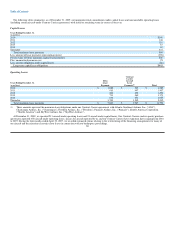
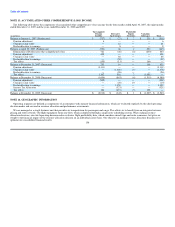
Assumptions
We used the following actuarial assumptions to determine our benefit obligations at December 31, 2009 and December 31, 2008 and our net periodic
(benefit) cost for the periods presented:
December 31,
Benefit Obligations(1)(2) 2009 2008
Weighted average discount rate 5.93% 6.49%
Assumed healthcare cost trend rate(3) 7.50% 8.00%
Successor Predecessor
Year Eight Months
Ended Ended Four Months
December 31, December 31, Ended April 30,
Net Periodic Benefit Cost(2)(4) 2009 2008 2007 2007
Weighted average discount rate—pension benefit 6.49% 7.19% 6.01% 5.99%
Weighted average discount rate—other postretirement benefit 6.46% 6.46% 5.63% 5.63%
Weighted average discount rate—other postemployment benefit 6.50% 6.95% 6.00% 5.63%
Weighted average expected long-term rate of return on plan assets 8.83% 8.96% 8.97% 8.96%
Assumed healthcare cost trend rate(3) 8.00% 8.00% 8.50% 8.50%
(1) Our 2009 and 2008 benefit obligations are measured using the RP 2000 combined healthy mortality table projected to 2013.
(2) Rate of increase in future compensation levels is not applicable for our frozen defined benefit pension plans and other postretirement plans and is only
applicable to a small portion of our other postemployment liability.
(3) The assumed healthcare cost trend rate at December 31, 2009 is assumed to decline gradually to 5.00% by 2015 and remain level thereafter.
(4) Our 2009, 2008 and 2007 assumptions reflect various remeasurements of certain portions of our obligations and represent the weighted average of the
assumptions used for each measurement date.
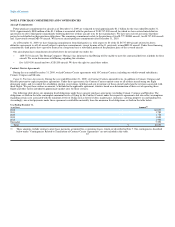
Assumed healthcare cost trend rates have an effect on the amounts reported for the other postretirement benefit plans. A 1% change in the healthcare cost
trend rate used in measuring the accumulated plan benefit obligation ("APBO") for these plans at December 31, 2009, would have the following effects:
1% 1%
(in millions) Increase Decrease
Increase (decrease) in total service and interest cost $ 7 $ (7)
Increase (decrease) in the APBO 55 (65)
The expected long-term rate of return on plan assets is based primarily on plan-specific investment studies using historical market returns and volatility
data with forward looking estimates based on existing financial market conditions and forecasts. Modest excess return expectations versus some market
indices are incorporated into the return projections based on the actively managed structure of the investment programs and their records of achieving such
returns historically. We review our rate of return on plan asset assumptions annually. These assumptions are largely based on the asset category rate-of-return
assumptions developed annually with our pension investment advisors. The advisors' asset category return assumptions are based in part on a review of
historical asset returns, but also emphasize current market conditions to develop estimates of future risk and return.
96