Asus 2010 Annual Report Download - page 95
Download and view the complete annual report
Please find page 95 of the 2010 Asus annual report below. You can navigate through the pages in the report by either clicking on the pages listed below, or by using the keyword search tool below to find specific information within the annual report.-
 1
1 -
2
-
3
-
4
-
5
-
6
-
7
-
8
-
9
-
10
-
11
-
12
-
13
-
14
-
15
-
16
-
17
-
18
-
19
-
20
-
21
-
22
-
23
-
24
-
25
-
26
-
27
-
28
-
29
-
30
-
31
-
32
-
33
-
34
-
35
-
36
-
37
-
38
-
39
-
40
-
41
-
42
-
43
-
44
-
45
-
46
-
47
-
48
-
49
-
50
-
51
-
52
-
53
-
54
-
55
-
56
-
57
-
58
-
59
-
60
-
61
-
62
-
63
-
64
-
65
-
66
-
67
-
68
-
69
-
70
-
71
-
72
-
73
-
74
-
75
-
76
-
77
-
78
-
79
-
80
-
81
-
82
-
83
-
84
-
 85
85 -
 86
86 -
 87
87 -
 88
88 -
 89
89 -
 90
90 -
 91
91 -
 92
92 -
 93
93 -
 94
94 -
 95
95 -
 96
96 -
 97
97 -
 98
98 -
 99
99 -
 100
100 -
 101
101 -
 102
102 -
 103
103 -
 104
104 -
 105
105 -
106
-
107
-
108
-
109
-
110
-
111
-
112
-
113
-
114
-
115
-
116
-
117
-
118
-
119
-
120
-
121
-
122
-
123
-
124
-
125
-
126
-
127
-
128
-
129
-
130
-
131
-
132
-
133
-
134
-
135
-
136
-
137
-
138
-
139
-
140
-
141
-
142
-
143
-
144
-
145
-
146
-
147
-
148
-
149
-
150
-
151
-
152
-
153
-
154
-
155
-
156
-
157
-
158
-
159
-
160
-
161
-
162
-
163
-
164
-
165
-
166
-
167
-
168
-
169
-
170
-
171
-
172
-
173
-
174
-
175
-
176
-
177
-
178
-
179
-
180
-
181
-
182
-
183
-
184
-
185
-
186
-
187
-
188
-
189
-
190
-
191
-
192
-
193
-
194
-
195
-
196
-
197
-
198
-
199
-
200
-
201
-
202
-
203
-
204
-
205
-
206
-
207
-
208
-
209
-
210
-
211
 |
 |

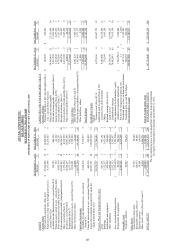
91
ASUSTeK COMPUTER INC.
STATEMENTS OF CASH FLOWS
FOR THE YEARS ENDED DECEMBER 31, 2010 AND 2009
(EXPRESSED IN THOUSANDS OF NEW TAIWAN DOLLARS)
For the years ended December 31,
2010 2009
Cash flows from operating activities
Net income
$16,488,357 $ 12,479,066
Adjustments to reconcile net income to net cash provided by operating activities:
Depreciation and amortization 1,277,002 1,432,376
Impairment loss 7,842 301,617
Cash dividends received from investee companies accounted for under the equity method 4,018,073 4,987,395
Investment income accounted for under the equity method ( 8,541,113) ( 7,572,667)
Changes in assets and liabilities:
Financial assets at fair value through profit or loss - current 5,098,429 ( 4,880,632)
Notes and accounts receivable (including related parties) ( 3,903,634) ( 8,081,853)
Other receivables (including related parties) 3,873,937 2,514,791
Inventories ( 492,802) 12,297,443
Prepayments ( 1,924,158) ( 205,356)
Deferred income tax assets and liabilities 830,365 ( 623,462)
Notes and accounts payable (including related parties) 6,206,849 11,170,820
Income tax payable ( 1,160,711) ( 1,282,878)
Accrued expenses ( 850,950) 1,698,316
Receipts in advance 87,499 ( 395,673)
Deferred credits 89,344 906,321
Others ( 85,659) ( 306,305)
Net cash provided by operating activities 21,018,670 24,439,319
Cash flows from investing activities
Acquisition of property, plant and equipment ( 1,098,447) ( 648,281)
Proceeds from disposal of available-for-sale financial assets 453,354 119,238
Proceeds from disposal of long-term investments accounted for under the equity method 857,577 278,450
Increase in long-term investments accounted for under the equity method ( 610,098) ( 1,222,913)
Proceeds from liquidation of investments 1,061,951 5,093,110
Increase in intangible assets and deferred expenses ( 63,697) ( 630,062)
Other assets-others 20,617 ( 3,237,679)
Others ( 50,499) ( 107,033)
Net cash provided by (used in) investing activities 570,758 ( 355,170)
Cash flows from financing activities
Redemption of bonds payable ( 1,346,450) ( 9,147,365)
Redemption of treasury stock ( 2,321,248) ( 873,459)
Cash dividends paid ( 8,918,232) ( 8,439,852)
Others 9,302 308
Net cash used in financing activities ( 12,576,628)( 18,460,368)
Net increase in cash and cash equivalents
9,012,800 5,623,781
Cash and cash equivalents at beginning of
year 16,402,090 10,778,309
Cash and cash equivalents at end of
year $ 25,414,890 $ 16,402,090
Supplemental disclosures of cash flow information
Cash paid during the year for interest $ 5 $ 121,861
Cash paid during the year for income tax $ 2,750,859 $ 2,595,706
Investing and financing activities that result in non
-cash flows:
Employee bonuses payable transferred to common stock and additional paid-in capital $ - $700,000
Bonds payable-– payable in one year $ 2,412,309 $ 3,647,296
Items affected by spin
-off
Long-term investment under the equity method ($ 70,197,726) $ -
Valuation accounts on long-term investment under the equity method
Additional paid-in capital-other 1,765,546 -
Cumulative translation adjustments 99,230 -
Net loss not recognized as pension cost ( 2,402) -
Unrealized gains on financial assets 1,221,037 -
Reduction of common stock due to spin-off 36,097,609 -
Reduction of paid-in capital in excess of par value due to spin-off 24,033,308 -
Reduction of retained earnings due to spin-off 6,983,398 -
$ - $ -
The accompanying notes are an integral part of these financial statements.
See report of independent accountants dated March 12, 2011