Asus 2010 Annual Report Download - page 131
Download and view the complete annual report
Please find page 131 of the 2010 Asus annual report below. You can navigate through the pages in the report by either clicking on the pages listed below, or by using the keyword search tool below to find specific information within the annual report.-
 1
1 -
2
-
3
-
4
-
5
-
6
-
7
-
8
-
9
-
10
-
11
-
12
-
13
-
14
-
15
-
16
-
17
-
18
-
19
-
20
-
21
-
22
-
23
-
24
-
25
-
26
-
27
-
28
-
29
-
30
-
31
-
32
-
33
-
34
-
35
-
36
-
37
-
38
-
39
-
40
-
41
-
42
-
43
-
44
-
45
-
46
-
47
-
48
-
49
-
50
-
51
-
52
-
53
-
54
-
55
-
56
-
57
-
58
-
59
-
60
-
61
-
62
-
63
-
64
-
65
-
66
-
67
-
68
-
69
-
70
-
71
-
72
-
73
-
74
-
75
-
76
-
77
-
78
-
79
-
80
-
81
-
82
-
83
-
84
-
85
-
86
-
87
-
88
-
89
-
90
-
91
-
92
-
93
-
94
-
95
-
96
-
97
-
98
-
99
-
100
-
101
-
102
-
103
-
104
-
105
-
106
-
107
-
108
-
109
-
110
-
111
-
112
-
113
-
114
-
115
-
116
-
117
-
118
-
119
-
120
-
 121
121 -
 122
122 -
 123
123 -
 124
124 -
 125
125 -
 126
126 -
 127
127 -
 128
128 -
 129
129 -
 130
130 -
 131
131 -
 132
132 -
 133
133 -
 134
134 -
 135
135 -
 136
136 -
 137
137 -
 138
138 -
 139
139 -
 140
140 -
 141
141 -
142
-
143
-
144
-
145
-
146
-
147
-
148
-
149
-
150
-
151
-
152
-
153
-
154
-
155
-
156
-
157
-
158
-
159
-
160
-
161
-
162
-
163
-
164
-
165
-
166
-
167
-
168
-
169
-
170
-
171
-
172
-
173
-
174
-
175
-
176
-
177
-
178
-
179
-
180
-
181
-
182
-
183
-
184
-
185
-
186
-
187
-
188
-
189
-
190
-
191
-
192
-
193
-
194
-
195
-
196
-
197
-
198
-
199
-
200
-
201
-
202
-
203
-
204
-
205
-
206
-
207
-
208
-
209
-
210
-
211
 |
 |

127
5
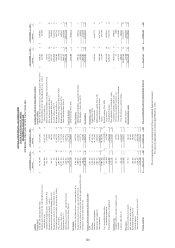
ASUSTek COMPUTER INC. AND SUBSIDIARIES
CONSOLIDATED STATEMENTS OF INCOME
FOR THE YEARS ENDED DECEMBER 31, 2010 AND 2009
(EXPRESSED IN THOUSANDS OF NEW TAIWAN DOLLARS, EXCEPT EARNINGS PER SHARE DATA)
For the years ended December 31
2010 2009
Amount %Amount %
Net sales
revenue (Note 5) $ 429,802,853 100 $ 610,120,403 100
Cost of goods sold
(Notes 4(7), (24) and 5) ( 373,295,560)( 87)( 548,105,350)( 90)
Gross profit
56,507,293 13 62,015,053 10
Operating expenses
(Notes 4(24) and 5)
Selling ( 23,216,036) ( 5) ( 21,306,349) ( 3)
General and administrative ( 6,224,202) ( 1) ( 10,106,984) ( 2)
Research and development (8,418,881)(2)( 14,867,522)(2)
Total operating expenses ( 37,859,119)(8)( 46,280,855)(7)
Operating income
18,648,174 515,734,198 3
Non
-operating income and gains
Interest income 245,222 -286,044 -
Investment income accounted for under the equity method
(Note 4(18))
1,110,159 -332,956 -
Dividends 362,148 -255,108 -
Gain on disposal of investments 540,364 -814,876 -
Gain on valuation of financial assets, net (Note 4(2)) 1,373,218 1 1,339,020 -
Gain on valuation of financial liabilities, net (Notes 4(2) and (15)) - - 192,867 -
Others 1,365,478 -3,476,936 1
Total non-operating income 4,996,589 16,697,807 1
Non
-operating expenses
Interest expense (Note 4(15)) ( 207,620) - ( 334,067) -
Foreign currency exchange loss, net ( 820,950) ( 1) (822,737) -
Impairment loss (Notes 4(3),(4),(10) and (12)) ( 239,361) - ( 958,461) -
Loss on valuation of financial liabilities, net (Note 4(2)) ( 324,249) - - -
Others ( 626,849) - ( 1,020,580) ( 1)
Total non-operating expenses ( 2,219,029)(1)( 3,135,845) ( 1)
Income before income tax
21,425,734 519,296,160 3
Income tax expense (Note 4(22))
(3,386,131)(1)( 3,040,625) -
Consolidated net income
$18,039,603 4$ 16,255,535 3
Attributable to:
Parent company’s shareholders $ 16,488,357 4$12,479,066 2
Minority interest 1,551,246 -3,776,469 1
$ 18,039,603 4$ 16,255,535 3
Before Tax
After Tax
Before Tax
After Tax
Basic earnings per share
(In dollars) (Note 4(23))
Net income
$
8.85
$
7.72
$ 3.02
$
2.94
Diluted earnings per share (In dollars)
Net income
$ 8.67
$
7.56
$ 2.95
$
2.87
Supplementary disclosures for spin-off and capital reduction:
Outstanding shares before the spin-off and capital reduction on June 1, 2010 were
4,246,777,000 shares; outstanding shares after the capital reduction were 637,017,000 shares.
The weighted-average number of shares outstanding for earnings per share calculation is
2,137,012,000 shares.
The accompanying notes are an integral part of these consolidated financial statements.
See report of independent accountants dated March 12, 2011.