Asus 2010 Annual Report Download - page 189
Download and view the complete annual report
Please find page 189 of the 2010 Asus annual report below. You can navigate through the pages in the report by either clicking on the pages listed below, or by using the keyword search tool below to find specific information within the annual report.-
 1
1 -
2
-
3
-
4
-
5
-
6
-
7
-
8
-
9
-
10
-
11
-
12
-
13
-
14
-
15
-
16
-
17
-
18
-
19
-
20
-
21
-
22
-
23
-
24
-
25
-
26
-
27
-
28
-
29
-
30
-
31
-
32
-
33
-
34
-
35
-
36
-
37
-
38
-
39
-
40
-
41
-
42
-
43
-
44
-
45
-
46
-
47
-
48
-
49
-
50
-
51
-
52
-
53
-
54
-
55
-
56
-
57
-
58
-
59
-
60
-
61
-
62
-
63
-
64
-
65
-
66
-
67
-
68
-
69
-
70
-
71
-
72
-
73
-
74
-
75
-
76
-
77
-
78
-
79
-
80
-
81
-
82
-
83
-
84
-
85
-
86
-
87
-
88
-
89
-
90
-
91
-
92
-
93
-
94
-
95
-
96
-
97
-
98
-
99
-
100
-
101
-
102
-
103
-
104
-
105
-
106
-
107
-
108
-
109
-
110
-
111
-
112
-
113
-
114
-
115
-
116
-
117
-
118
-
119
-
120
-
121
-
122
-
123
-
124
-
125
-
126
-
127
-
128
-
129
-
130
-
131
-
132
-
133
-
134
-
135
-
136
-
137
-
138
-
139
-
140
-
141
-
142
-
143
-
144
-
145
-
146
-
147
-
148
-
149
-
150
-
151
-
152
-
153
-
154
-
155
-
156
-
157
-
158
-
159
-
160
-
161
-
162
-
163
-
164
-
165
-
166
-
167
-
168
-
169
-
170
-
171
-
172
-
173
-
174
-
175
-
176
-
177
-
178
-
 179
179 -
 180
180 -
 181
181 -
 182
182 -
 183
183 -
 184
184 -
 185
185 -
 186
186 -
 187
187 -
 188
188 -
 189
189 -
 190
190 -
 191
191 -
 192
192 -
 193
193 -
 194
194 -
 195
195 -
 196
196 -
 197
197 -
 198
198 -
 199
199 -
200
-
201
-
202
-
203
-
204
-
205
-
206
-
207
-
208
-
209
-
210
-
211
 |
 |

185
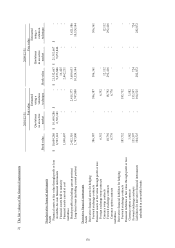
Item 2010 2009 Amount change Ratio change (%)
(Minus) add: Realized
(unrealized) gross profit of the
affiliates
(89,344) (906,321) 816,977 (90.14)
Realized gross profit 17,402,516 11,059,471 6,343,045 57.35
Operating expense (8,066,169) (7,513,776) (552,393) 7.35
Operating income 9,336,347 3,545,695 5,790,652 163.32
Non-operating income and gain
Interest income 91,168 71,798 19,370 26.98
Investment income (Equity
Method) 8,541,113 7,572,667 968,446 12.79
Dividend income 338,950 235,002 103,948 44.23
Gain from exchange - 823,503 (823,503) (100.00)
Gain from financial asset
valuation 466,044 143,601 322,443 224.54
Gain from financial liability
valuation - 192,378 (192,378) (100.00)
Other income 794,371 725,316 69,055 9.52
Total non-operating income
and gain 10,231,646 9,764,265 467,381 4.79
Non-operating expense and loss
Interest expense 81,045 101,497 (20,452) (20.15)
Foreign currency exchange
gain, loss 400,516 - 400,516 100.00
Impairment loss 7,842 301,617 (293,775) (97.40)
Gain on valuation of
financial liabilities, loss 44,971 - 44,971 100,00
Other loss 124,749 86,076 38,673 44.93
Total Non-operating
expense and loss 659,123 489,190 169,933 34.74
Net income before tax 18,908,870 12,820,770 6,088,100 47.49
Minus: Estimated income tax (2,420,513) (341,704) (2,078,809) 608.37
Net income $16,488,357 $12,479,066 4,009,291 32.13
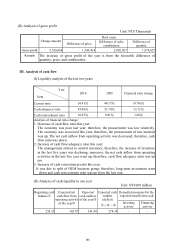
Analysis of financial ratio change:
1. Operating income and operating cost: It was due to the economic recovery of the year with growing
demand of the emerging markets; therefore, sales revenue went up.
2. Operating expense: Expenses went up due to the increase of sales revenue this year.
3. Non-operating income and gain: Investment earnings with equity method had gone up from the year
before.
4. Estimated income tax expense: The higher tax expense this year was due to the increase of taxable
income this year.