Asus 2010 Annual Report Download - page 159
Download and view the complete annual report
Please find page 159 of the 2010 Asus annual report below. You can navigate through the pages in the report by either clicking on the pages listed below, or by using the keyword search tool below to find specific information within the annual report.-
 1
1 -
2
-
3
-
4
-
5
-
6
-
7
-
8
-
9
-
10
-
11
-
12
-
13
-
14
-
15
-
16
-
17
-
18
-
19
-
20
-
21
-
22
-
23
-
24
-
25
-
26
-
27
-
28
-
29
-
30
-
31
-
32
-
33
-
34
-
35
-
36
-
37
-
38
-
39
-
40
-
41
-
42
-
43
-
44
-
45
-
46
-
47
-
48
-
49
-
50
-
51
-
52
-
53
-
54
-
55
-
56
-
57
-
58
-
59
-
60
-
61
-
62
-
63
-
64
-
65
-
66
-
67
-
68
-
69
-
70
-
71
-
72
-
73
-
74
-
75
-
76
-
77
-
78
-
79
-
80
-
81
-
82
-
83
-
84
-
85
-
86
-
87
-
88
-
89
-
90
-
91
-
92
-
93
-
94
-
95
-
96
-
97
-
98
-
99
-
100
-
101
-
102
-
103
-
104
-
105
-
106
-
107
-
108
-
109
-
110
-
111
-
112
-
113
-
114
-
115
-
116
-
117
-
118
-
119
-
120
-
121
-
122
-
123
-
124
-
125
-
126
-
127
-
128
-
129
-
130
-
131
-
132
-
133
-
134
-
135
-
136
-
137
-
138
-
139
-
140
-
141
-
142
-
143
-
144
-
145
-
146
-
147
-
148
-
 149
149 -
 150
150 -
 151
151 -
 152
152 -
 153
153 -
 154
154 -
 155
155 -
 156
156 -
 157
157 -
 158
158 -
 159
159 -
 160
160 -
 161
161 -
 162
162 -
 163
163 -
 164
164 -
 165
165 -
 166
166 -
 167
167 -
 168
168 -
 169
169 -
170
-
171
-
172
-
173
-
174
-
175
-
176
-
177
-
178
-
179
-
180
-
181
-
182
-
183
-
184
-
185
-
186
-
187
-
188
-
189
-
190
-
191
-
192
-
193
-
194
-
195
-
196
-
197
-
198
-
199
-
200
-
201
-
202
-
203
-
204
-
205
-
206
-
207
-
208
-
209
-
210
-
211
 |
 |

155
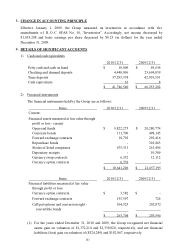
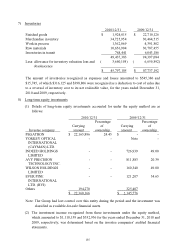
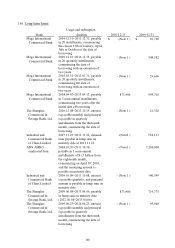
7) Inventories
2010/12/31 2009/12/31
Finished goods $ 1,924,015 $ 22,710,126
Merchandise inventory 34,725,954 30,464,515
Work in process 1,362,069 4,391,802
Raw materials 10,656,904 30,787,455
Inventories in transit 768,441 6,043,186
49,437,383 94,397,084
Less: allowance for inventory valuation loss and
obsolescence
( 3,640,198) ( 6,659,892)
$ 45,797,185 $ 87,737,192
The amount of inventories recognized as expenses and losses amounted to $545,386 and
$15,745, of which $316,125 and $398,806 were recognized as a deduction to cost of sales due
to a reversal of inventory cost to its net realizable value, for the years ended December 31,
2010 and 2009, respectively.
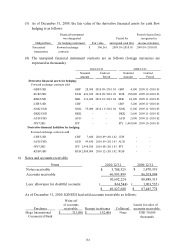
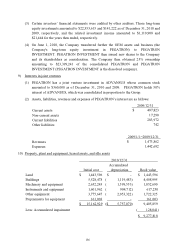
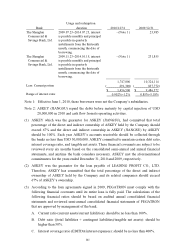
8) Long-term equity investments
(1) Details of long-term equity investments accounted for under the equity method are as
follows:
2010/
12
/3
1
2009/
12
/3
1
Percentage
Percentage
Carrying of Carrying of
Investee company
amount
ownership
amount
ownership
PEGATRON
$ 22,165,896
24.4
5
$
-
-
YORKEY
OPTICAL
INTERNATIONAL
(CAYMAN) LTD.
- - Note -
INDEED HOLDINGS
LIMITED
- - 726,939 49.00
AVY PRECISION
TECHNOLOGY INC.
- - 811,883 20.39
WILSON HOLDINGS
LIMITED
- - 160,340 49.00
EVER PINE
INTERNATIONAL
LTD. (BVI)
- - 121,207 34.65
Others 194,270 325,407
$ 22,360,166 $ 2,145,776
Note: The Group had lost control over this entity during the period and the investment was
classified as available-for-sale financial assets.
(2) The investment income recognized from these investments under the equity method,
which amounted to $1,110,159 and $332,956 for the years ended December 31, 2010 and
2009, respectively, was determined based on the investee companies’ audited financial
statements.