Asus 2010 Annual Report Download - page 173
Download and view the complete annual report
Please find page 173 of the 2010 Asus annual report below. You can navigate through the pages in the report by either clicking on the pages listed below, or by using the keyword search tool below to find specific information within the annual report.-
 1
1 -
2
-
3
-
4
-
5
-
6
-
7
-
8
-
9
-
10
-
11
-
12
-
13
-
14
-
15
-
16
-
17
-
18
-
19
-
20
-
21
-
22
-
23
-
24
-
25
-
26
-
27
-
28
-
29
-
30
-
31
-
32
-
33
-
34
-
35
-
36
-
37
-
38
-
39
-
40
-
41
-
42
-
43
-
44
-
45
-
46
-
47
-
48
-
49
-
50
-
51
-
52
-
53
-
54
-
55
-
56
-
57
-
58
-
59
-
60
-
61
-
62
-
63
-
64
-
65
-
66
-
67
-
68
-
69
-
70
-
71
-
72
-
73
-
74
-
75
-
76
-
77
-
78
-
79
-
80
-
81
-
82
-
83
-
84
-
85
-
86
-
87
-
88
-
89
-
90
-
91
-
92
-
93
-
94
-
95
-
96
-
97
-
98
-
99
-
100
-
101
-
102
-
103
-
104
-
105
-
106
-
107
-
108
-
109
-
110
-
111
-
112
-
113
-
114
-
115
-
116
-
117
-
118
-
119
-
120
-
121
-
122
-
123
-
124
-
125
-
126
-
127
-
128
-
129
-
130
-
131
-
132
-
133
-
134
-
135
-
136
-
137
-
138
-
139
-
140
-
141
-
142
-
143
-
144
-
145
-
146
-
147
-
148
-
149
-
150
-
151
-
152
-
153
-
154
-
155
-
156
-
157
-
158
-
159
-
160
-
161
-
162
-
 163
163 -
 164
164 -
 165
165 -
 166
166 -
 167
167 -
 168
168 -
 169
169 -
 170
170 -
 171
171 -
 172
172 -
 173
173 -
 174
174 -
 175
175 -
 176
176 -
 177
177 -
 178
178 -
 179
179 -
 180
180 -
 181
181 -
 182
182 -
 183
183 -
184
-
185
-
186
-
187
-
188
-
189
-
190
-
191
-
192
-
193
-
194
-
195
-
196
-
197
-
198
-
199
-
200
-
201
-
202
-
203
-
204
-
205
-
206
-
207
-
208
-
209
-
210
-
211
 |
 |

169
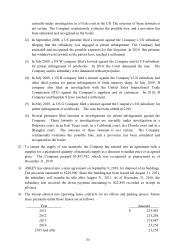
(7) Unappropriated retained earnings
2010/12/31 2009/12/31
Earnings generated in and before 1997 $ 706,803 $ 2,858,766
Earnings generated in and after 1998 74,095,212 74,756,392
$ 74,802,015 $ 77,615,158
(8) According to the ROC Income Tax Act, the unused tax credits of the Group in the R.O.C.
can be carried forward over a period of three years.
The unused investment tax credits are as follows:
Name of Company Unused tax credits Expiry year
Askey and its subsidiaries $ 409,330 2011~2013
Other consolidated subsidiaries 157,906 2011~2013
$567,236
(9) According to the ROC Income Tax Act, losses which can be used to offset against future
taxable income are as follows:
Year in which Unused
Name of Company loss was incurred loss carryforwards Expiry year
Askey and its subsidiaries 2009 and 2010 $62,540 2019~2020
Other consolidated subsidiaries 2003~2010 291,358 2013~2020
$353,898
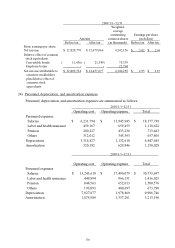
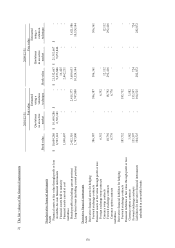
23) Earnings per share
2010/1/1~12/31
Weighted-
average
outstanding Earnings per share
Amount common shares (in dollars)
Before tax After tax (in thousands) Before tax After tax
Basic earnings per share:
Net income $ 18,908,870 $16,488,357 2,137,012 $ 8.85 $ 7.72
Dilutive effect of common
stock equivalents:
Convertible bonds ( 69,835) ( 69,921) 29,799
Employee bonus --6,109
Net income attributable to
common stockholders
plus dilutive effect of
common stock
equivalents
$18,839,035 $16,418,436 2,172,920 $ 8.67 $ 7.56