Asus 2010 Annual Report Download - page 72
Download and view the complete annual report
Please find page 72 of the 2010 Asus annual report below. You can navigate through the pages in the report by either clicking on the pages listed below, or by using the keyword search tool below to find specific information within the annual report.-
 1
1 -
2
-
3
-
4
-
5
-
6
-
7
-
8
-
9
-
10
-
11
-
12
-
13
-
14
-
15
-
16
-
17
-
18
-
19
-
20
-
21
-
22
-
23
-
24
-
25
-
26
-
27
-
28
-
29
-
30
-
31
-
32
-
33
-
34
-
35
-
36
-
37
-
38
-
39
-
40
-
41
-
42
-
43
-
44
-
45
-
46
-
47
-
48
-
49
-
50
-
51
-
52
-
53
-
54
-
55
-
56
-
57
-
58
-
59
-
60
-
61
-
 62
62 -
 63
63 -
 64
64 -
 65
65 -
 66
66 -
 67
67 -
 68
68 -
 69
69 -
 70
70 -
 71
71 -
 72
72 -
 73
73 -
 74
74 -
 75
75 -
 76
76 -
 77
77 -
 78
78 -
 79
79 -
 80
80 -
 81
81 -
 82
82 -
83
-
84
-
85
-
86
-
87
-
88
-
89
-
90
-
91
-
92
-
93
-
94
-
95
-
96
-
97
-
98
-
99
-
100
-
101
-
102
-
103
-
104
-
105
-
106
-
107
-
108
-
109
-
110
-
111
-
112
-
113
-
114
-
115
-
116
-
117
-
118
-
119
-
120
-
121
-
122
-
123
-
124
-
125
-
126
-
127
-
128
-
129
-
130
-
131
-
132
-
133
-
134
-
135
-
136
-
137
-
138
-
139
-
140
-
141
-
142
-
143
-
144
-
145
-
146
-
147
-
148
-
149
-
150
-
151
-
152
-
153
-
154
-
155
-
156
-
157
-
158
-
159
-
160
-
161
-
162
-
163
-
164
-
165
-
166
-
167
-
168
-
169
-
170
-
171
-
172
-
173
-
174
-
175
-
176
-
177
-
178
-
179
-
180
-
181
-
182
-
183
-
184
-
185
-
186
-
187
-
188
-
189
-
190
-
191
-
192
-
193
-
194
-
195
-
196
-
197
-
198
-
199
-
200
-
201
-
202
-
203
-
204
-
205
-
206
-
207
-
208
-
209
-
210
-
211
 |
 |
68
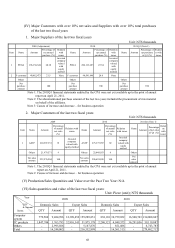
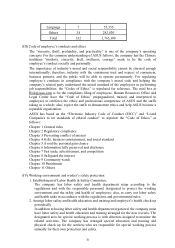
(IV) Major Customers with over 10% net sales and Suppliers with over 10% total purchases
of the last two fiscal years
1. Major Suppliers of the last two fiscal years
Unit: NT$ thousands
2009 (Adjustment) 2010 2011Q1 (Note 1)
Item Name Amount
Percentage of
net annual
purchase (%)
Relation
with
issuer
Name Amount
Percentage of
net annual
purchase (%)
Relation
with
issuer
Name Amount
Percentage of
net purchase
of Q1 (%)
Relatio
n with
issuer
1 PEGA 196,136,624 60.18
Invested
company
valued
with
equity
method
PEGA 206,113,685 47.34
Invested
company
valued
with
equity
method
2 F customer 40,882,473 21.5 None F customer 90,541,846 20.8 None
Others Others Others
Net
purchase
amount
100
Net
purchase
amount
100
Net
purchase
amount
100
Note 1: The 2011Q1 financial statements audited by the CPA were not yet available up to the print of annual
report on April 21, 2011.
Note 2: The aforementioned purchase amount of the last two years included the procurement of raw material
on behalf of the affiliates.
Note 3: Causes of increase and decrease – for business operation
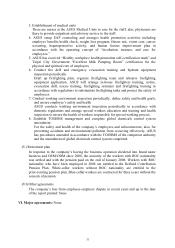
2. Major Customers of the last two fiscal years
Unit: NT$ thousands
2009 2010 2011Q1 (Note 1)
Item Name Amount
Percentage
of annual
net sales
(%)
Relation with
issuer Name Amount
Percentage
of annual
net sales
(%)
Relation
with issuer
Name
Amount
Percentage
of net sales
of Q1 (%)
Relati
on
with
issuer
1 ASTP 210,597,333 91
Invested
company
valued with
equity method
ASTP 273,375,997 92
Invested
company
valued with
equity
method
Others 21,979,571 9 Others 23,048,033 8 Others
Net sales
amount 232,576,904 100 Net sales
amount 296,424,030 100
Net
sales
amount
Note 1: The 2011Q1 financial statements audited by the CPA were not yet available up to the print of annual
report on April 21, 2011.
Note 2: Causes of increase and decrease – for business operation
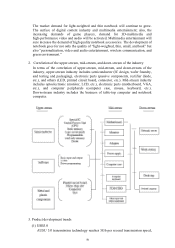
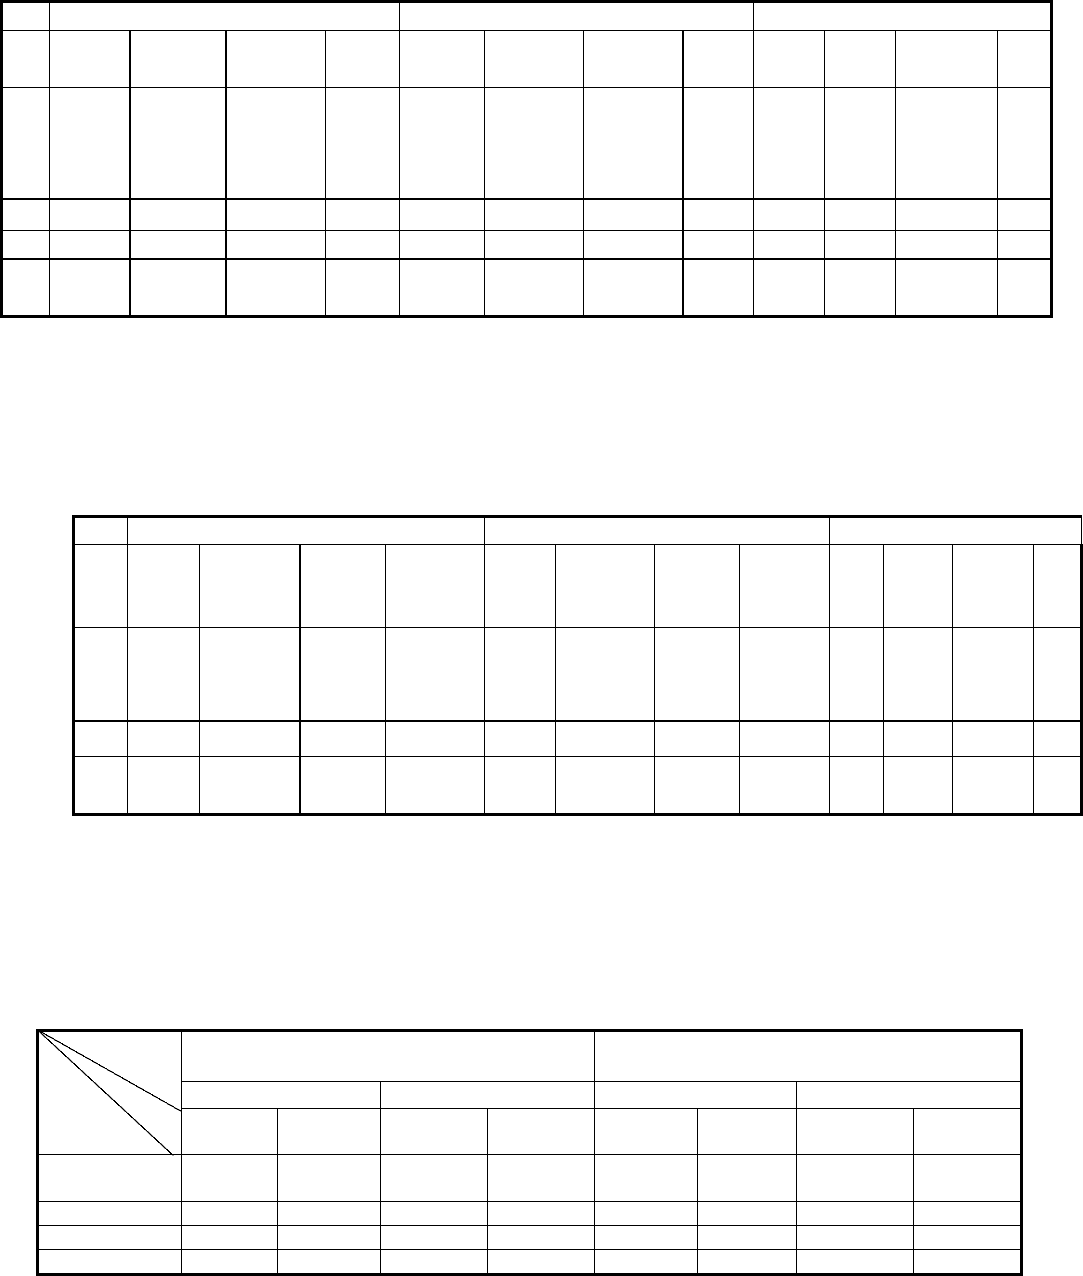
(V) Production/Sales Quantities and Value over the Past Two Year: N/A
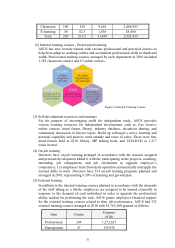
(VI) Sales quantities and value of the last two fiscal years:
Unit: Piece (unit); NT$ thousands
2009 2010
Domestic Sales Export Sales Domestic Sales Export Sales
QTY Amount QTY Amount QTY Amount QTY Amount
Computer
system 779,560 9,484,706 12,309,452 159,289,851 838,101 10,759,852 16,540,763 214,008,847
3C products 1,847,744 3,763,793 32,910,343 51,875,178 2,240,321 4,949,575 36,291,056 59,110,087
Others - 2,995,506 - 5,167,870 - 851,886 - 6,743,783
Total - 16,244,005 - 216,332,899 - 16,561,313 - 279,862,717
Year
QTY
& Amount
Items