Asus 2010 Annual Report Download - page 186
Download and view the complete annual report
Please find page 186 of the 2010 Asus annual report below. You can navigate through the pages in the report by either clicking on the pages listed below, or by using the keyword search tool below to find specific information within the annual report.-
 1
1 -
2
-
3
-
4
-
5
-
6
-
7
-
8
-
9
-
10
-
11
-
12
-
13
-
14
-
15
-
16
-
17
-
18
-
19
-
20
-
21
-
22
-
23
-
24
-
25
-
26
-
27
-
28
-
29
-
30
-
31
-
32
-
33
-
34
-
35
-
36
-
37
-
38
-
39
-
40
-
41
-
42
-
43
-
44
-
45
-
46
-
47
-
48
-
49
-
50
-
51
-
52
-
53
-
54
-
55
-
56
-
57
-
58
-
59
-
60
-
61
-
62
-
63
-
64
-
65
-
66
-
67
-
68
-
69
-
70
-
71
-
72
-
73
-
74
-
75
-
76
-
77
-
78
-
79
-
80
-
81
-
82
-
83
-
84
-
85
-
86
-
87
-
88
-
89
-
90
-
91
-
92
-
93
-
94
-
95
-
96
-
97
-
98
-
99
-
100
-
101
-
102
-
103
-
104
-
105
-
106
-
107
-
108
-
109
-
110
-
111
-
112
-
113
-
114
-
115
-
116
-
117
-
118
-
119
-
120
-
121
-
122
-
123
-
124
-
125
-
126
-
127
-
128
-
129
-
130
-
131
-
132
-
133
-
134
-
135
-
136
-
137
-
138
-
139
-
140
-
141
-
142
-
143
-
144
-
145
-
146
-
147
-
148
-
149
-
150
-
151
-
152
-
153
-
154
-
155
-
156
-
157
-
158
-
159
-
160
-
161
-
162
-
163
-
164
-
165
-
166
-
167
-
168
-
169
-
170
-
171
-
172
-
173
-
174
-
175
-
 176
176 -
 177
177 -
 178
178 -
 179
179 -
 180
180 -
 181
181 -
 182
182 -
 183
183 -
 184
184 -
 185
185 -
 186
186 -
 187
187 -
 188
188 -
 189
189 -
 190
190 -
 191
191 -
 192
192 -
 193
193 -
 194
194 -
 195
195 -
 196
196 -
197
-
198
-
199
-
200
-
201
-
202
-
203
-
204
-
205
-
206
-
207
-
208
-
209
-
210
-
211
 |
 |

182
2009
/
12
/3
1
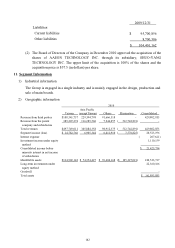
Liabilities:
Current liabilities
$ 95,700,856
Other liabilities
8,700,306
$ 104,401,162
(2) The Board of Directors of the Company in December 2010 approved the acquisition of the
shares of AAEON TECHNOLOGY INC. through its subsidiary, SHUO-YANG
TECHNOLOGY INC. The upper limit of the acquisition is 100% of the shares and the
acquisition price is $57.5 (in dollars) per share.
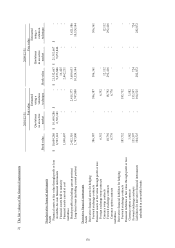
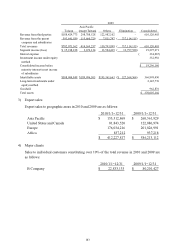
11. Segment Information
1) Industrial information
The Group is engaged in a single industry and is mainly engaged in the design, production and
sale of main boards.
2) Geographic information
2010
Asia Pacific
Taiwan
(
except Taiwan) Others Elimination Consolidated
Revenue from third parties $108,541,737 229,594,798 91,666,318 -429,802,853
Revenue from the parent
company and subsidiaries
389,207,274 116,289,560 7,246,057 ( 512,742,891) -
Total revenues $497,749,011 345,884,358 98,912,375 ( 512,742,891)429,802,853
Segment income (loss) $ 14,782,766 6,905,344 6,411,910 ( 7,576,825)20,523,196
Interest expense ( 207,621)
Investment income under equity
method
1,110,159
Consolidated income before
minority interest in net income
of subsidiaries
$21,425,734
Identifiable assets $134,902,143 $ 74,354,427 $76,604,168 ($ 105,327,021)180,533,717
Long-term investments under
equity method
22,360,166
Goodwill -
Total assets $202,893,883