Asus 2010 Annual Report Download - page 106
Download and view the complete annual report
Please find page 106 of the 2010 Asus annual report below. You can navigate through the pages in the report by either clicking on the pages listed below, or by using the keyword search tool below to find specific information within the annual report.-
 1
1 -
2
-
3
-
4
-
5
-
6
-
7
-
8
-
9
-
10
-
11
-
12
-
13
-
14
-
15
-
16
-
17
-
18
-
19
-
20
-
21
-
22
-
23
-
24
-
25
-
26
-
27
-
28
-
29
-
30
-
31
-
32
-
33
-
34
-
35
-
36
-
37
-
38
-
39
-
40
-
41
-
42
-
43
-
44
-
45
-
46
-
47
-
48
-
49
-
50
-
51
-
52
-
53
-
54
-
55
-
56
-
57
-
58
-
59
-
60
-
61
-
62
-
63
-
64
-
65
-
66
-
67
-
68
-
69
-
70
-
71
-
72
-
73
-
74
-
75
-
76
-
77
-
78
-
79
-
80
-
81
-
82
-
83
-
84
-
85
-
86
-
87
-
88
-
89
-
90
-
91
-
92
-
93
-
94
-
95
-
 96
96 -
 97
97 -
 98
98 -
 99
99 -
 100
100 -
 101
101 -
 102
102 -
 103
103 -
 104
104 -
 105
105 -
 106
106 -
 107
107 -
 108
108 -
 109
109 -
 110
110 -
 111
111 -
 112
112 -
 113
113 -
 114
114 -
 115
115 -
 116
116 -
117
-
118
-
119
-
120
-
121
-
122
-
123
-
124
-
125
-
126
-
127
-
128
-
129
-
130
-
131
-
132
-
133
-
134
-
135
-
136
-
137
-
138
-
139
-
140
-
141
-
142
-
143
-
144
-
145
-
146
-
147
-
148
-
149
-
150
-
151
-
152
-
153
-
154
-
155
-
156
-
157
-
158
-
159
-
160
-
161
-
162
-
163
-
164
-
165
-
166
-
167
-
168
-
169
-
170
-
171
-
172
-
173
-
174
-
175
-
176
-
177
-
178
-
179
-
180
-
181
-
182
-
183
-
184
-
185
-
186
-
187
-
188
-
189
-
190
-
191
-
192
-
193
-
194
-
195
-
196
-
197
-
198
-
199
-
200
-
201
-
202
-
203
-
204
-
205
-
206
-
207
-
208
-
209
-
210
-
211
 |
 |

102
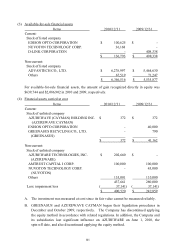
C. After evaluating and comparing the carrying value of financial assets carried at cost and
the recoverable amount, no impairment loss was recognized for the years ended
December 31, 2010 and 2009.
(5) Notes and accounts receivable
2010/12/31 2009/12/31
Notes receivable $ - $ 5
Accounts receivable 9,191,918 902,409
9,191,918 902,414
Less: allowance for doubtful accounts ( 108,004) ( 82,263)
$ 9,083,914 $ 820,151
(6) Inventories
2010/12/31 2009/12/31
Raw materials $ 5,602,157 $ 2,817,832
Work in process 826,566 514,009
Finished goods 712,639 167,682
Merchandise inventory 10,249,608 13,379,163
Inventories in transit 80,601 596,863
17,471,571 17,475,549
Less: allowance for inventory valuation loss and
obsolescence ( 1,891,274) ( 2,388,054)
$ 15,580,297 $ 15,087,495
The amount of inventories recognized as net gain amounted to $492,549 and $406,281, of
which $496,780 and $409,800 were recognized as deduction from cost of sales due to a
reversal of inventory cost to its net realizable value for the years ended December 31, 2010
and 2009, respectively.