Asus 2010 Annual Report Download - page 187
Download and view the complete annual report
Please find page 187 of the 2010 Asus annual report below. You can navigate through the pages in the report by either clicking on the pages listed below, or by using the keyword search tool below to find specific information within the annual report.-
 1
1 -
2
-
3
-
4
-
5
-
6
-
7
-
8
-
9
-
10
-
11
-
12
-
13
-
14
-
15
-
16
-
17
-
18
-
19
-
20
-
21
-
22
-
23
-
24
-
25
-
26
-
27
-
28
-
29
-
30
-
31
-
32
-
33
-
34
-
35
-
36
-
37
-
38
-
39
-
40
-
41
-
42
-
43
-
44
-
45
-
46
-
47
-
48
-
49
-
50
-
51
-
52
-
53
-
54
-
55
-
56
-
57
-
58
-
59
-
60
-
61
-
62
-
63
-
64
-
65
-
66
-
67
-
68
-
69
-
70
-
71
-
72
-
73
-
74
-
75
-
76
-
77
-
78
-
79
-
80
-
81
-
82
-
83
-
84
-
85
-
86
-
87
-
88
-
89
-
90
-
91
-
92
-
93
-
94
-
95
-
96
-
97
-
98
-
99
-
100
-
101
-
102
-
103
-
104
-
105
-
106
-
107
-
108
-
109
-
110
-
111
-
112
-
113
-
114
-
115
-
116
-
117
-
118
-
119
-
120
-
121
-
122
-
123
-
124
-
125
-
126
-
127
-
128
-
129
-
130
-
131
-
132
-
133
-
134
-
135
-
136
-
137
-
138
-
139
-
140
-
141
-
142
-
143
-
144
-
145
-
146
-
147
-
148
-
149
-
150
-
151
-
152
-
153
-
154
-
155
-
156
-
157
-
158
-
159
-
160
-
161
-
162
-
163
-
164
-
165
-
166
-
167
-
168
-
169
-
170
-
171
-
172
-
173
-
174
-
175
-
176
-
 177
177 -
 178
178 -
 179
179 -
 180
180 -
 181
181 -
 182
182 -
 183
183 -
 184
184 -
 185
185 -
 186
186 -
 187
187 -
 188
188 -
 189
189 -
 190
190 -
 191
191 -
 192
192 -
 193
193 -
 194
194 -
 195
195 -
 196
196 -
 197
197 -
198
-
199
-
200
-
201
-
202
-
203
-
204
-
205
-
206
-
207
-
208
-
209
-
210
-
211
 |
 |

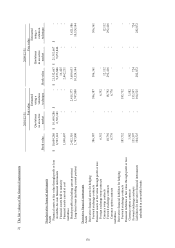
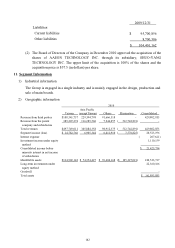
183
2009
Asia Pacific
Taiwan
(
except Taiwan) Others Elimination Consolidated
Revenue from third parties $188,429,773 298,708,528 122,982,102 -610,120,403
Revenue from the parent
company and subsidiaries
593,641,589 115,660,729 7,811,797 ( 717,114,115) -
Total revenues $782,071,362 414,369,257 130,793,899 ( 717,114,115)610,120,403
Segment income (loss) $ 15,918,238 3,672,134 13,504,419 ( 13,797,520)19,297,271
Interest expense ( 334,067)
Investment income under equity
method
332,956
Consolidated income before
minority interest in net income
of subsidiaries
$19,296,160
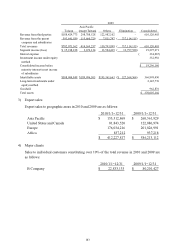
Identifiable assets $308,904,848 $189,996,503 $195,361,663 ($ 327,364,564)366,898,450
Long-term investments under
equity method
2,145,776
Goodwill 962,876
Total assets $370,007,102
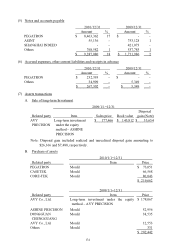
3) Export sales
Export sales to geographic areas in 2010 and 2009 are as follows:
2010/1/1~12/31 2009/1/1~12/31
Asia Pacific $ 153,512,869 $ 260,561,929
United States and Canada 81,843,520 122,886,974
Europe 176,034,216 201,826,991
Africa 837,212 937,218
$ 412,227,817 $ 586,213,112
4) Major clients
Sales to individual customers constituting over 10% of the total revenue in 2010 and 2009 are
as follows:
2010/1/1~12/31 2009/1/1~12/31
B Company $ 22,833,133 $ 80,201,427