Asus 2010 Annual Report Download - page 174
Download and view the complete annual report
Please find page 174 of the 2010 Asus annual report below. You can navigate through the pages in the report by either clicking on the pages listed below, or by using the keyword search tool below to find specific information within the annual report.-
 1
1 -
2
-
3
-
4
-
5
-
6
-
7
-
8
-
9
-
10
-
11
-
12
-
13
-
14
-
15
-
16
-
17
-
18
-
19
-
20
-
21
-
22
-
23
-
24
-
25
-
26
-
27
-
28
-
29
-
30
-
31
-
32
-
33
-
34
-
35
-
36
-
37
-
38
-
39
-
40
-
41
-
42
-
43
-
44
-
45
-
46
-
47
-
48
-
49
-
50
-
51
-
52
-
53
-
54
-
55
-
56
-
57
-
58
-
59
-
60
-
61
-
62
-
63
-
64
-
65
-
66
-
67
-
68
-
69
-
70
-
71
-
72
-
73
-
74
-
75
-
76
-
77
-
78
-
79
-
80
-
81
-
82
-
83
-
84
-
85
-
86
-
87
-
88
-
89
-
90
-
91
-
92
-
93
-
94
-
95
-
96
-
97
-
98
-
99
-
100
-
101
-
102
-
103
-
104
-
105
-
106
-
107
-
108
-
109
-
110
-
111
-
112
-
113
-
114
-
115
-
116
-
117
-
118
-
119
-
120
-
121
-
122
-
123
-
124
-
125
-
126
-
127
-
128
-
129
-
130
-
131
-
132
-
133
-
134
-
135
-
136
-
137
-
138
-
139
-
140
-
141
-
142
-
143
-
144
-
145
-
146
-
147
-
148
-
149
-
150
-
151
-
152
-
153
-
154
-
155
-
156
-
157
-
158
-
159
-
160
-
161
-
162
-
163
-
 164
164 -
 165
165 -
 166
166 -
 167
167 -
 168
168 -
 169
169 -
 170
170 -
 171
171 -
 172
172 -
 173
173 -
 174
174 -
 175
175 -
 176
176 -
 177
177 -
 178
178 -
 179
179 -
 180
180 -
 181
181 -
 182
182 -
 183
183 -
 184
184 -
185
-
186
-
187
-
188
-
189
-
190
-
191
-
192
-
193
-
194
-
195
-
196
-
197
-
198
-
199
-
200
-
201
-
202
-
203
-
204
-
205
-
206
-
207
-
208
-
209
-
210
-
211
 |
 |

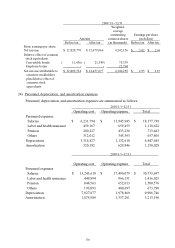
170
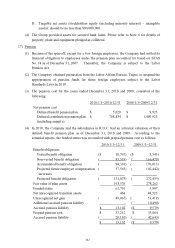
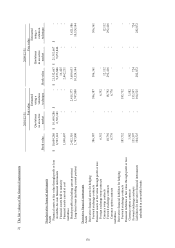
2009/1/1~12/31
Weighted-
average
outstanding Earnings per share
Amount common shares (in dollars)
Before tax After tax (in thousands) Before tax After tax
Basic earnings per share:
Net income $ 12,820,770 $12,479,066 4,242,156 $ 3.02 $2.94
Dilutive effect of common
stock equivalents:
Convertible bonds ( 11,436) (21,389) 75,339
Employee bonus --22,764
Net income attributable to
common stockholders
plus dilutive effect of
common stock
equivalents
$12,809,334 $12,457,677 4,340,259 $ 2.95 $2.87
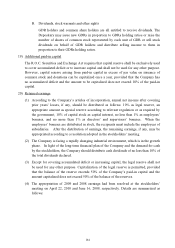
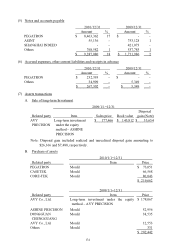
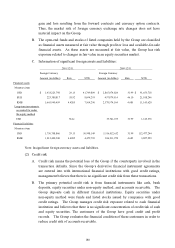
24) Personnel, depreciation, and amortization expenses
Personnel, depreciation, and amortization expenses are summarized as follows:
2010/1/1~12/31
Operating cost Operating expense Total
Personnel expenses
Salaries $ 6,231,794 $ 11,945,945 $ 18,177,739
Labor and health insurance 459,167 659,455 1,118,622
Pension 280,227 433,236 713,463
Others 312,012 345,393 657,405
Depreciation 3,314,827 1,132,618 4,447,445
Amortization 520,182 629,846 1,150,028
2009/1/1~12/31
Operating cost Operating expense Total
Personnel expenses
Salaries $ 13,243,618 $ 17,490,079 $ 30,733,697
Labor and health insurance 449,894 966,131 1,416,025
Pension 848,563 652,013 1,500,576
Others 193,093 480,697 673,790
Depreciation 7,927,877 1,978,869 9,906,746
Amortization 1,875,989 1,337,201 3,213,190