Asus 2010 Annual Report Download - page 93
Download and view the complete annual report
Please find page 93 of the 2010 Asus annual report below. You can navigate through the pages in the report by either clicking on the pages listed below, or by using the keyword search tool below to find specific information within the annual report.-
 1
1 -
2
-
3
-
4
-
5
-
6
-
7
-
8
-
9
-
10
-
11
-
12
-
13
-
14
-
15
-
16
-
17
-
18
-
19
-
20
-
21
-
22
-
23
-
24
-
25
-
26
-
27
-
28
-
29
-
30
-
31
-
32
-
33
-
34
-
35
-
36
-
37
-
38
-
39
-
40
-
41
-
42
-
43
-
44
-
45
-
46
-
47
-
48
-
49
-
50
-
51
-
52
-
53
-
54
-
55
-
56
-
57
-
58
-
59
-
60
-
61
-
62
-
63
-
64
-
65
-
66
-
67
-
68
-
69
-
70
-
71
-
72
-
73
-
74
-
75
-
76
-
77
-
78
-
79
-
80
-
81
-
82
-
 83
83 -
 84
84 -
 85
85 -
 86
86 -
 87
87 -
 88
88 -
 89
89 -
 90
90 -
 91
91 -
 92
92 -
 93
93 -
 94
94 -
 95
95 -
 96
96 -
 97
97 -
 98
98 -
 99
99 -
 100
100 -
 101
101 -
 102
102 -
 103
103 -
104
-
105
-
106
-
107
-
108
-
109
-
110
-
111
-
112
-
113
-
114
-
115
-
116
-
117
-
118
-
119
-
120
-
121
-
122
-
123
-
124
-
125
-
126
-
127
-
128
-
129
-
130
-
131
-
132
-
133
-
134
-
135
-
136
-
137
-
138
-
139
-
140
-
141
-
142
-
143
-
144
-
145
-
146
-
147
-
148
-
149
-
150
-
151
-
152
-
153
-
154
-
155
-
156
-
157
-
158
-
159
-
160
-
161
-
162
-
163
-
164
-
165
-
166
-
167
-
168
-
169
-
170
-
171
-
172
-
173
-
174
-
175
-
176
-
177
-
178
-
179
-
180
-
181
-
182
-
183
-
184
-
185
-
186
-
187
-
188
-
189
-
190
-
191
-
192
-
193
-
194
-
195
-
196
-
197
-
198
-
199
-
200
-
201
-
202
-
203
-
204
-
205
-
206
-
207
-
208
-
209
-
210
-
211
 |
 |

89
5
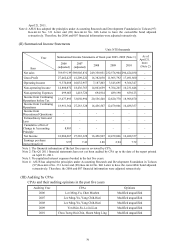
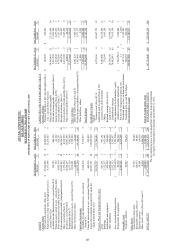
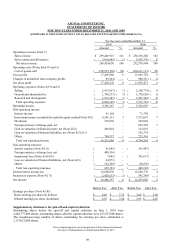
ASUSTek COMPUTER INC.
STATEMENTS OF INCOME
FOR THE YEARS ENDED DECEMBER 31, 2010 AND 2009
(EXPRESSED IN THOUSANDS OF NEW TAIWAN DOLLARS, EXCEPT EARNINGS PER SHARE DATA)
For the years ended December 31
2010 2009
Amount %Amount %
Operating revenues (Note 5)
Sales revenue $ 299,440,915 101 $ 236,530,280 102
Sales returns and allowances ( 3,016,885)
(
1) ( 3,953,376)(2)
Net sales revenue 296,424,030 100 232,576,904 100
Operating costs (Notes 4(6)(19)
and 5)
Cost of goods sold ( 278,932,170)
(
94) ( 220,611,112)( 95)
Gross profit
17,491,860 6 11,965,792 5
Changes in unrealized inter
-company profits ( 89,344) - ( 906,321)(1)
Net gross profit
17,402,516 611,059,471 4
Operating expenses (Note
s 4(19) and 5)
Selling ( 2,413,553)
(
1) ( 2,169,774) ( 1)
General and administrative ( 1,780,233)
(
1) ( 1,376,620) ( 1)
Research and development ( 3,872,383)
(
1) ( 3,967,382)(2)
Total operating expenses ( 8,066,169)
(
3) ( 7,513,776)(4)
Operating income
9,336,347 33,545,695 -
Non
-operating income
Interest income 91,168 - 71,798 -
Investment income accounted for under the equity method (Note
4(7))
8,541,113 3 7,572,667 3
Dividends 338,950 - 235,002 -
Foreign currency exchange gain, net - - 823,503 1
Gain on valuation of financial assets, net (Note 4(2)) 466,044 - 143,601 -
Gain on valuation of financial liabilities, net (Notes 4(2)(11)) - - 192,378 -
Others 794,371 1725,316 -
Total non-operating income 10,231,646 49,764,265 4
Non
-operating expenses
Interest expense (Note 4(11)) ( 81,045) -( 101,497) -
Foreign currency exchange loss, net ( 400,516) ---
Impairment loss (Notes 4(4)(10)) ( 7,842) -( 301,617) -
Loss on valuation of financial liabilities, net (Note 4(2)) ( 44,971) ---
Others ( 124,749) - ( 86,076) -
Total non-operating expenses ( 659,123) - ( 489,190) -
Income before income tax
18,908,870 7 12,820,770 4
Income tax expense (Note 4(17))
( 2,420,513)
(
1) ( 341,704) -
Net income
$ 16,488,357 6$ 12,479,066 4
Before Tax
After Tax
Before Tax
After Tax
Earnings per share (Note 4(18))
Basic earnings per share (In dollars)
$
8.85
$
7.72
$ 3.02
$
2.94
Diluted earnings per share (In dollars)
$ 8.67
$
7.56
$ 2.95
$
2.87
Supplementary disclosures for spin-off and capital reduction:
Outstanding shares before the spin-off and capital reduction on June 1, 2010 were
4,246,777,000 shares; outstanding shares after the capital reduction were 637,017,000 shares.
The weighted-average number of shares outstanding for earnings per share calculation is
2,137,012,000 shares.
The accompanying notes are an integral part of these financial statements.
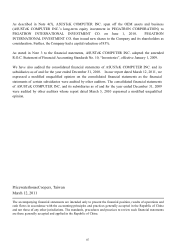
See report of independent accountants dated March 12, 2011