Asus 2010 Annual Report Download - page 161
Download and view the complete annual report
Please find page 161 of the 2010 Asus annual report below. You can navigate through the pages in the report by either clicking on the pages listed below, or by using the keyword search tool below to find specific information within the annual report.-
 1
1 -
2
-
3
-
4
-
5
-
6
-
7
-
8
-
9
-
10
-
11
-
12
-
13
-
14
-
15
-
16
-
17
-
18
-
19
-
20
-
21
-
22
-
23
-
24
-
25
-
26
-
27
-
28
-
29
-
30
-
31
-
32
-
33
-
34
-
35
-
36
-
37
-
38
-
39
-
40
-
41
-
42
-
43
-
44
-
45
-
46
-
47
-
48
-
49
-
50
-
51
-
52
-
53
-
54
-
55
-
56
-
57
-
58
-
59
-
60
-
61
-
62
-
63
-
64
-
65
-
66
-
67
-
68
-
69
-
70
-
71
-
72
-
73
-
74
-
75
-
76
-
77
-
78
-
79
-
80
-
81
-
82
-
83
-
84
-
85
-
86
-
87
-
88
-
89
-
90
-
91
-
92
-
93
-
94
-
95
-
96
-
97
-
98
-
99
-
100
-
101
-
102
-
103
-
104
-
105
-
106
-
107
-
108
-
109
-
110
-
111
-
112
-
113
-
114
-
115
-
116
-
117
-
118
-
119
-
120
-
121
-
122
-
123
-
124
-
125
-
126
-
127
-
128
-
129
-
130
-
131
-
132
-
133
-
134
-
135
-
136
-
137
-
138
-
139
-
140
-
141
-
142
-
143
-
144
-
145
-
146
-
147
-
148
-
149
-
150
-
 151
151 -
 152
152 -
 153
153 -
 154
154 -
 155
155 -
 156
156 -
 157
157 -
 158
158 -
 159
159 -
 160
160 -
 161
161 -
 162
162 -
 163
163 -
 164
164 -
 165
165 -
 166
166 -
 167
167 -
 168
168 -
 169
169 -
 170
170 -
 171
171 -
172
-
173
-
174
-
175
-
176
-
177
-
178
-
179
-
180
-
181
-
182
-
183
-
184
-
185
-
186
-
187
-
188
-
189
-
190
-
191
-
192
-
193
-
194
-
195
-
196
-
197
-
198
-
199
-
200
-
201
-
202
-
203
-
204
-
205
-
206
-
207
-
208
-
209
-
210
-
211
 |
 |

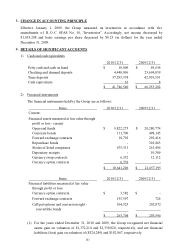
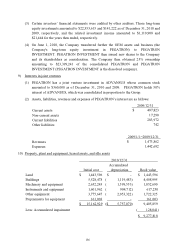
157
2009/12/31
Accumulated
Initial cost depreciation Book value
Land $ 4,349,763 $ - $ 4,349,763
Buildings 29,872,128 ( 4,891,802) 24,980,326
Machinery and equipment 48,315,649 ( 22,350,743) 25,964,906
Instruments and equipment 3,603,244 ( 1,872,039) 1,731,205
Other equipment 10,404,413 ( 5,000,966) 5,403,447
Prepayments for equipment 2,522,562 - 2,522,562
$ 99,067,759 ($ 34,115,550) 64,952,209
Less: Accumulated impairment ( 235,304)
$ 64,716,905
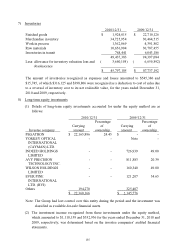
(1) After evaluating and comparing the carrying value of property, plant, and equipment and
the expected recoverable amount, the Group recognized loss on impairment of $140,489
and reversal of impairment loss of $29,788 for the years ended December 31, 2010 and
2009, respectively.
(2) Please refer to Note 6 for details of property, plant and equipment pledged as collateral.
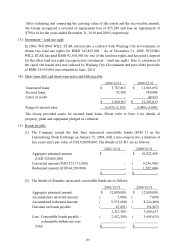
11) Leased assets
2010/12/31 2009/12/31
Initial cost
Land $ 79,156 $ -
Buildings 72,790 1,069,305
151,946 1,069,305
Less: accumulated depreciation ( 14,630) ( 127,809)
accumulated impairment - ( 69,061)
Add: fair value adjustment for identifiable assets -9,692
( 14,630) ( 187,178)
$ 137,316 $ 882,127
Please refer to Note 6 for details of leased assets pledged as collateral.
12) Idle assets
2010/12/31 2009/12/31
Initial cost
Buildings and equipment $ - $ 986,829
Machinery and others 1,465,032 3,334,624
1,465,032 4,321,453
Less: accumulated depreciation ( 1 ,114,453) ( 2,140,009)
accumulated impairment ( 350,579) ( 1,334,186)
( 1,465,032) ( 3,474,195)
$ - $ 847,258