Asus 2010 Annual Report Download - page 188
Download and view the complete annual report
Please find page 188 of the 2010 Asus annual report below. You can navigate through the pages in the report by either clicking on the pages listed below, or by using the keyword search tool below to find specific information within the annual report.-
 1
1 -
2
-
3
-
4
-
5
-
6
-
7
-
8
-
9
-
10
-
11
-
12
-
13
-
14
-
15
-
16
-
17
-
18
-
19
-
20
-
21
-
22
-
23
-
24
-
25
-
26
-
27
-
28
-
29
-
30
-
31
-
32
-
33
-
34
-
35
-
36
-
37
-
38
-
39
-
40
-
41
-
42
-
43
-
44
-
45
-
46
-
47
-
48
-
49
-
50
-
51
-
52
-
53
-
54
-
55
-
56
-
57
-
58
-
59
-
60
-
61
-
62
-
63
-
64
-
65
-
66
-
67
-
68
-
69
-
70
-
71
-
72
-
73
-
74
-
75
-
76
-
77
-
78
-
79
-
80
-
81
-
82
-
83
-
84
-
85
-
86
-
87
-
88
-
89
-
90
-
91
-
92
-
93
-
94
-
95
-
96
-
97
-
98
-
99
-
100
-
101
-
102
-
103
-
104
-
105
-
106
-
107
-
108
-
109
-
110
-
111
-
112
-
113
-
114
-
115
-
116
-
117
-
118
-
119
-
120
-
121
-
122
-
123
-
124
-
125
-
126
-
127
-
128
-
129
-
130
-
131
-
132
-
133
-
134
-
135
-
136
-
137
-
138
-
139
-
140
-
141
-
142
-
143
-
144
-
145
-
146
-
147
-
148
-
149
-
150
-
151
-
152
-
153
-
154
-
155
-
156
-
157
-
158
-
159
-
160
-
161
-
162
-
163
-
164
-
165
-
166
-
167
-
168
-
169
-
170
-
171
-
172
-
173
-
174
-
175
-
176
-
177
-
 178
178 -
 179
179 -
 180
180 -
 181
181 -
 182
182 -
 183
183 -
 184
184 -
 185
185 -
 186
186 -
 187
187 -
 188
188 -
 189
189 -
 190
190 -
 191
191 -
 192
192 -
 193
193 -
 194
194 -
 195
195 -
 196
196 -
 197
197 -
 198
198 -
199
-
200
-
201
-
202
-
203
-
204
-
205
-
206
-
207
-
208
-
209
-
210
-
211
 |
 |

184
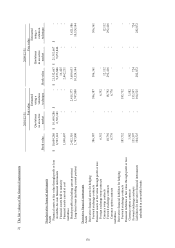
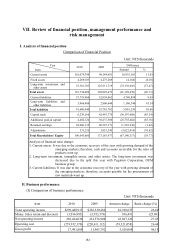
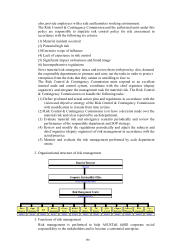
VII. Review of financial position, management performance and
risk management
I. Analysis of financial position
Comparison of Financial Position
Unit: NT$ thousands
Year
Item
2010 2009 Difference
Amount %
Current assets 110,079,794 99,144,691 10,935,103 11.03
Fixed assets 4,269,103 4,273,269 (4,166) (0.10)
Long-term investment and
other assets 53,381,703 125,511,719 (72,130,016) (57.47)
Total assets 167,730,600 228,929,679 (61,199,079) (26.73)
Current liabilities 57,719,960 52,939,062 4,780,898 9.03
Long-term liabilities and
other liabilities 3,966,980 2,806,640 1,160,340 41.34
Total liabilities 61,686,940 55,745,702 5,941,238 10.66
Capital stock 6,270,166 42,467,775 (36.197,608) (85.24)
Additional paid-in capital 4,482,124 30,237,586 (25,755,462) (85.18)
Retained earnings 94,960,135 96,525,371 (1,565,236) (1.62)
Adjustments 331,235 3,953,245 (3,622,010) (91.62)
Total Shareholders’ Equity 106,043,660 173,183,977 (67,140,317) (38.77)
Analysis of financial ratio change:
1. Current assets: It was due to the economic recovery of the year with growing demand of the
emerging markets; therefore, cash and accounts receivable for the sales o
f
products went up.
2. Long-term investment, intangible assets, and other assets: The long-term investment was
decreased due to the split this year with Pegatron Corporation, OEM
business group.
3. Current liabilities: It was due to the economic recovery of the year with growing demand o
f
the emerging markets; therefore, accounts payable for the procurement o
f
raw materials went up.
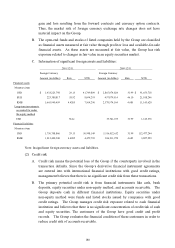
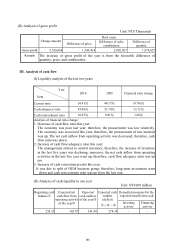
II. Business performance
(I) Comparison of business performance
Unit: NT$ thousands
Item 2010 2009 Amount change Ratio change (%)
Total operating income $299,440,915 $236,530,280 62,910,635 26.60
Minus: Sales return and discount (3,016,885) (3,953,376) 936,491 (23.69)
Net operating income 296,424,030 232,576,904 63,847,126 27.45
Operating cost (278,932,170) (220,611,112) (58,321,058) 26.44
Gross profit 17,491,860 11,965,792 5,526,068 46.18