Asus 2010 Annual Report Download - page 92
Download and view the complete annual report
Please find page 92 of the 2010 Asus annual report below. You can navigate through the pages in the report by either clicking on the pages listed below, or by using the keyword search tool below to find specific information within the annual report.-
 1
1 -
2
-
3
-
4
-
5
-
6
-
7
-
8
-
9
-
10
-
11
-
12
-
13
-
14
-
15
-
16
-
17
-
18
-
19
-
20
-
21
-
22
-
23
-
24
-
25
-
26
-
27
-
28
-
29
-
30
-
31
-
32
-
33
-
34
-
35
-
36
-
37
-
38
-
39
-
40
-
41
-
42
-
43
-
44
-
45
-
46
-
47
-
48
-
49
-
50
-
51
-
52
-
53
-
54
-
55
-
56
-
57
-
58
-
59
-
60
-
61
-
62
-
63
-
64
-
65
-
66
-
67
-
68
-
69
-
70
-
71
-
72
-
73
-
74
-
75
-
76
-
77
-
78
-
79
-
80
-
81
-
 82
82 -
 83
83 -
 84
84 -
 85
85 -
 86
86 -
 87
87 -
 88
88 -
 89
89 -
 90
90 -
 91
91 -
 92
92 -
 93
93 -
 94
94 -
 95
95 -
 96
96 -
 97
97 -
 98
98 -
 99
99 -
 100
100 -
 101
101 -
 102
102 -
103
-
104
-
105
-
106
-
107
-
108
-
109
-
110
-
111
-
112
-
113
-
114
-
115
-
116
-
117
-
118
-
119
-
120
-
121
-
122
-
123
-
124
-
125
-
126
-
127
-
128
-
129
-
130
-
131
-
132
-
133
-
134
-
135
-
136
-
137
-
138
-
139
-
140
-
141
-
142
-
143
-
144
-
145
-
146
-
147
-
148
-
149
-
150
-
151
-
152
-
153
-
154
-
155
-
156
-
157
-
158
-
159
-
160
-
161
-
162
-
163
-
164
-
165
-
166
-
167
-
168
-
169
-
170
-
171
-
172
-
173
-
174
-
175
-
176
-
177
-
178
-
179
-
180
-
181
-
182
-
183
-
184
-
185
-
186
-
187
-
188
-
189
-
190
-
191
-
192
-
193
-
194
-
195
-
196
-
197
-
198
-
199
-
200
-
201
-
202
-
203
-
204
-
205
-
206
-
207
-
208
-
209
-
210
-
211
 |
 |

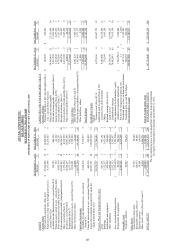
88
ASUSTeK COMPUTER INC.
BALANCE SHEETS
DECEMBER 31, 2010 AND 2009
(EXPRESSED IN THOUSANDS OF NEW TAIWAN DOLLARS)
DECEMBER 31, 2010
DECEMBER 31, 20
0
9
DECEMBER 31, 2010
DECEMBER 31, 20
0
9
Amount
%
Amount
%
Amount
%
Amount
%
ASSETS
LIABILITIES AND STOCKHOLDERS
’
EQUITY
Current Assets
Current
Liabilities
Cash and cash equivalents (Note 4(1))
$ 25,414,890
15
$ 16,402,090
7
Financial liabilities at
fair value through profit or
$
10
5
,895
-
$
285
,
823
-
Financial assets at fair value
through
profit or loss
-
8,137,398
5
13,235,827
6
loss
-
current (Note
s
4(2)
(
11
)
)
current (Note 4(2))
Notes and accounts payable
34,980,443
21
23
,
251
,
045
10
Available
-
for
-
sale
financial
assets
-
current (Note 4(3))
136,793
-
408,338
-
Notes and accounts payable
-
related parties (Note 5)
9,435,702
6
13
,
536
,
909
6
Financial assets carried at cost
-
current (Note 4(4))
372
-
41,162
-
Income tax payable
(Note 4(17))
1,316,542
1
2
,
477
,
253
1
Notes and accounts receivable (Note 4(5))
9,083,914
6
820,151
-
Accrued expenses (Note 5)
8,759,568
5
9
,
121
,
510
4
Notes and
accounts
receivable
-
related parties (Note 5)
41,845,943
25
46,266,237
20
Receipts in
advance (Note 5)
648,550
-
561
,
051
-
Other receivables
(Note 5)
2,176,324
1
4,632,939
2
Current portion of bonds payable (Note 4(11))
2,412,309
2
3
,
647
,
296
2
Inventories
-
net
(Note 4(6))
15,580,297
9
15,087,495
7
Other current
liabilities
(Note 5)
60,951
-
58
,
175
-
Prepayments (Note 7)
6,673,156
4
1,042,990
-
57,719,960
35
52
,
939
,
062
23
Deferred income tax assets
-
current (Note 4(17))
1,014,641
1
1,192,244
1
Other Liabilities
Other current assets
-
others
16,066
-
15,218
-
Deferred credits (Note
s
4(7) and 5)
2,051,225
1
1
,
430
,
172
1
110,079,794
66
99,144,691
43
Deferred income tax
liabilities
-
non
-
current (Note 4(17))
1,903,869
1
1
,
371
,
177
-
Funds
and Investments
Other liabilities
-
others
11,886
-
5
,
291
-
Available
-
for
-
sale financial assets
-
non
-
current
6,346,516
4
5,535,877
2
3,966,980
2
2
,
806
,
640
1
(Note 4(3))
Total Liabilities
61,686,940
37
55
,
745
,
702
24
Financial assets carried at cost
-
non
-
current (Note 4(4))
400,520
-
242,859
-
Long
-
term investments accounted for under the
46,223,721
28
116,009,948
51
Stockholders
’
Equity
equity method
(Note 4(7))
Capital
52,970,757
32
121,788,684
53
Common stock (Note 4(13))
6,270,166
4
42
,
467
,
775
19
Property, Plant and Equipment (Note 4(8))
Additional paid
-
in capital (Note 4(14))
Land
981,191
1
981,191
1
Common stock share premium
4,205,880
2
28
,
274
,
481
12
Buildings
2,312,517
1
2,421,641
1
Others
276,244
-
1,963
,
105
1
Instruments and equipment
442,298
-
866,628
-
Retained earnings (Note 4(15))
Other equipment
1,796,127
1
1,494,377
1
Legal
reserve
20,158,120
12
18
,
910
,
213
8
5,532
,
133
3
5,763,837
3
Undistributed earnings
74,802,015
45
77
,
615
,
158
34
Less: Accumulated depreciation
( 1,355,422)
( 1)
( 1,595,280)
( 1)
Other adjustments to
stockholders
’
equity
Prepayments for equipment
92
,
392
-
104,712
-
Cumulative translation adjustments
( 1,066,766)
( 1)
1,
490
,
885
1
4,269,103
2
4,273,269
2
Net loss not recognized as pension cost
11
-
(
3
,
202
)
-
Intangible Asset
Unrealized gain or loss on financial instruments
1,197,335
1
2
,
159
,
201
1
Computer software
89,987
-
174,074
-
Unrealized gain on cash flow hedges
200,655
-
306
,
361
-
Total Stockholders
’
Equity
106,043,660
63
173
,
183
,
977
76
Other
Assets
Leased assets (Note 4(9))
97,372
-
98,909
-
Refundable deposits (Note 6)
158,972
-
84,805
-
Deferred expense
s
56,001
-
119,016
-
Other assets
-
others (Note 4(10)
and 7
)
8,614
-
3,246,231
2
320,959
-
3,548,961
2
TOTAL LIABILIT
I
ES AND
TOTAL ASSETS
$ 167,730,600 100 $ 228,929,679 100 STOCKHOLDERS’ EQUITY $ 167,730,600 100 $ 228,929,679 100
The accompanying notes are an integral part of these financial statements.
See report of independent accountants dated March 12, 2011.