Asus 2010 Annual Report Download - page 209
Download and view the complete annual report
Please find page 209 of the 2010 Asus annual report below. You can navigate through the pages in the report by either clicking on the pages listed below, or by using the keyword search tool below to find specific information within the annual report.-
 1
1 -
2
-
3
-
4
-
5
-
6
-
7
-
8
-
9
-
10
-
11
-
12
-
13
-
14
-
15
-
16
-
17
-
18
-
19
-
20
-
21
-
22
-
23
-
24
-
25
-
26
-
27
-
28
-
29
-
30
-
31
-
32
-
33
-
34
-
35
-
36
-
37
-
38
-
39
-
40
-
41
-
42
-
43
-
44
-
45
-
46
-
47
-
48
-
49
-
50
-
51
-
52
-
53
-
54
-
55
-
56
-
57
-
58
-
59
-
60
-
61
-
62
-
63
-
64
-
65
-
66
-
67
-
68
-
69
-
70
-
71
-
72
-
73
-
74
-
75
-
76
-
77
-
78
-
79
-
80
-
81
-
82
-
83
-
84
-
85
-
86
-
87
-
88
-
89
-
90
-
91
-
92
-
93
-
94
-
95
-
96
-
97
-
98
-
99
-
100
-
101
-
102
-
103
-
104
-
105
-
106
-
107
-
108
-
109
-
110
-
111
-
112
-
113
-
114
-
115
-
116
-
117
-
118
-
119
-
120
-
121
-
122
-
123
-
124
-
125
-
126
-
127
-
128
-
129
-
130
-
131
-
132
-
133
-
134
-
135
-
136
-
137
-
138
-
139
-
140
-
141
-
142
-
143
-
144
-
145
-
146
-
147
-
148
-
149
-
150
-
151
-
152
-
153
-
154
-
155
-
156
-
157
-
158
-
159
-
160
-
161
-
162
-
163
-
164
-
165
-
166
-
167
-
168
-
169
-
170
-
171
-
172
-
173
-
174
-
175
-
176
-
177
-
178
-
179
-
180
-
181
-
182
-
183
-
184
-
185
-
186
-
187
-
188
-
189
-
190
-
191
-
192
-
193
-
194
-
195
-
196
-
197
-
198
-
 199
199 -
 200
200 -
 201
201 -
 202
202 -
 203
203 -
 204
204 -
 205
205 -
 206
206 -
 207
207 -
 208
208 -
 209
209 -
 210
210 -
 211
211
 |
 |

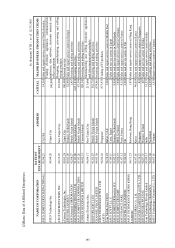
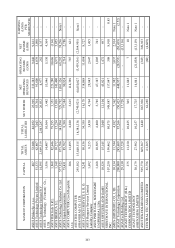
205
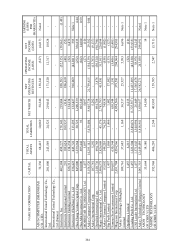
NAME OF CORPORATION CAPITAL TOTAL
ASSETS
TOTAL
LIABILITIES NET WORTH
NET
OPERATING
REVENUES
OPERATING
INCOME
(LOSS)
NET
INCOME
(LOSS)
EARNING
(LOSS)
PER
SHARE(NTD)
WUJIANG WILL STAR
INVESTMENTS LIMITED 639,601 628,933 18 628,915 - (86) (5,360) Note 1
ASMEDIA TECHNOLOGY INC. 400,000 515,408 267,978 247,430 642,468 66,350 46,889 (1.96)
GREAT EXTEND INVESTMENT
CORP. 15,221 560 261 299 - (427) (4,893) -
Shuo Yang Technology Co. Ltd. 10,000 10,006 374 9,632 - (369) (368) -
Note 1: It’s not applied to company limited.
Note 2: The Company had lost of control over Pegatron Corporation since June 1, 2010.