Asus 2010 Annual Report Download - page 130
Download and view the complete annual report
Please find page 130 of the 2010 Asus annual report below. You can navigate through the pages in the report by either clicking on the pages listed below, or by using the keyword search tool below to find specific information within the annual report.-
 1
1 -
2
-
3
-
4
-
5
-
6
-
7
-
8
-
9
-
10
-
11
-
12
-
13
-
14
-
15
-
16
-
17
-
18
-
19
-
20
-
21
-
22
-
23
-
24
-
25
-
26
-
27
-
28
-
29
-
30
-
31
-
32
-
33
-
34
-
35
-
36
-
37
-
38
-
39
-
40
-
41
-
42
-
43
-
44
-
45
-
46
-
47
-
48
-
49
-
50
-
51
-
52
-
53
-
54
-
55
-
56
-
57
-
58
-
59
-
60
-
61
-
62
-
63
-
64
-
65
-
66
-
67
-
68
-
69
-
70
-
71
-
72
-
73
-
74
-
75
-
76
-
77
-
78
-
79
-
80
-
81
-
82
-
83
-
84
-
85
-
86
-
87
-
88
-
89
-
90
-
91
-
92
-
93
-
94
-
95
-
96
-
97
-
98
-
99
-
100
-
101
-
102
-
103
-
104
-
105
-
106
-
107
-
108
-
109
-
110
-
111
-
112
-
113
-
114
-
115
-
116
-
117
-
118
-
119
-
 120
120 -
 121
121 -
 122
122 -
 123
123 -
 124
124 -
 125
125 -
 126
126 -
 127
127 -
 128
128 -
 129
129 -
 130
130 -
 131
131 -
 132
132 -
 133
133 -
 134
134 -
 135
135 -
 136
136 -
 137
137 -
 138
138 -
 139
139 -
 140
140 -
141
-
142
-
143
-
144
-
145
-
146
-
147
-
148
-
149
-
150
-
151
-
152
-
153
-
154
-
155
-
156
-
157
-
158
-
159
-
160
-
161
-
162
-
163
-
164
-
165
-
166
-
167
-
168
-
169
-
170
-
171
-
172
-
173
-
174
-
175
-
176
-
177
-
178
-
179
-
180
-
181
-
182
-
183
-
184
-
185
-
186
-
187
-
188
-
189
-
190
-
191
-
192
-
193
-
194
-
195
-
196
-
197
-
198
-
199
-
200
-
201
-
202
-
203
-
204
-
205
-
206
-
207
-
208
-
209
-
210
-
211
 |
 |

126
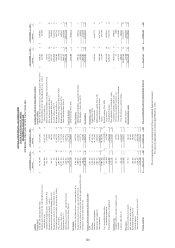
ASUSTeK COMPUTER INC. AND SUBSIDIARIES
CONSOLIDATED BALANCE SHEETS
DECEMBER 31, 2010 AND 2009
(EXPRESSED IN THOUSANDS OF NEW TAIWAN DOLLARS)
DECEMBER 31, 2010 DECEMBER 31, 2009 DECEMBER 31, 2010 DECEMBER 31, 2009
Amount % Amount % Amount % Amount %
ASSETS
LIABILITIES AND STOCKHOLDERS
’ EQUITY
Current Assets
Current
Liabilities
Cash and cash equivalents (Note 4(1)) $ 41,746,540 21 $ 66,253,202 18 Short-term debt and short-term notes and bills payable (Note 4(14)) $ 3,860,363 2 $ 12,503,033 3
Financial assets measured at fair value through profit or loss - Financial liabilities at fair value through profit or loss - current 263,704 - 283,596 -
current (Note 4(2)) 10,641,206 5 21,657,195 6 (Notes 4(2) and( 15))
Available-for-sale financial assets - current (Note 4(3)) 136,793 - 1,848,464 - Derivative financial liabilities for hedging-current (Note 4(5)) 185,732 --
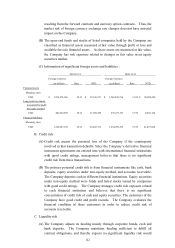
Financial assets held to maturity – current - - 16,425 - Notes and accounts payable (Note 5) 51,196,534 26 98,634,612 27
Derivative financial assets for hedging (Note 4(5)) 386,387 - 306,361 - Income tax payable (Note 4(22)) 2,231,977 1 3,950,865 1
Financial assets carried at cost - current (Note 4(4)) 372 - 41,162 - Accrued expenses (Note 5) 22,054,060 11 23,667,158 6
Notes and accounts receivable, net (Notes 4(6), 5 and 6) 49,827,680 24 87,485,778 23 Receipts in advance (Note 5) 6,509,903 3 4,627,738 1
Other receivables 3,807,594 2 6,123,019 2 Current portion of long-term debt (Note 4(16)) 291,300 - 837,772 -
Inventories (Note 4(7)) 45,797,185 23 87,737,192 24 Bonds payable-current (Note 4(15)) 2,412,310 1 3,609,633 1
Prepayments (Note 7) 7,148,143 3 1,437,015 - Other current liabilities (Note 5) 4,048,413 2 12,638,963 4
Deferred income tax assets - current (Note 4(22)) 1,638,031 1 2,607,912 1 93,054,296 46 160,753,370 43
Other current assets-others (Note 6) 107,939 - 2,777,270 1
Long
-term liability
161,237,870 79 278,290,995 75 Long-term loans (Note 4(16) 1,456,500 1 9,486,372 3
Investments
Available-for-sale financial assets - non-current (Note 4(3)) 6,366,348 3 7,805,382 2
Other Liabilities
Financial assets carried at cost - non-current (Note 4(4)) 1,090,035 1 2,421,049 1 Deferred income tax liabilities - non-current (Note 4(22)) 1,905,362 1 1,701,561 1
Long-term investments accounted for under the equity method (Note 4(8)) 22,360,166 11 2,145,776 - Other liabilities – others (Note 4(17)) 119,445 - 414,835 -
Investment - land use right (Note 4(13)) 324,471 - 432,705 - 2,024,807 1 2,116,396 1
30,141,020 15 12,804,912 3
Total
liabilities 96,535,603 48 172,356,138 47
Property, plant and equipment (Notes 4(10) and 6
)
Land 1,443,596 1 4,349,763 1
Stockholders
’ equity
Buildings 5,528,478 3 29,872,128 8 Capital (Note 4(18))
Machinery and equipment 2,652,243 1 48,315,649 13 Common stock 6,270,166 3 42,467,775 11
Instruments and equipment 1,601,962 1 3,603,244 1 Additional paid-in capital (Note 4(19))
Other equipment 3,775,647 2 10,404,413 3 Common stock share premium 4,205,880 2 28,274,481 8
15,001,926 8 96,545,197 26 Others 276,244 - 1,963,105 1
Less: accumulated depreciation ( 5,757,070) ( 3) ( 34,115,550) ( 9) Retained earnings (Note 4(20))
accumulated impairment ( 128,041) - ( 235,304) - Legal reserve 20,158,120 10 18,910,213 5
Prepayments for purchase of equipment 161,003 - 2,522,562 1 Undistributed earnings 74,802,015 37 77,615,158 21
9,277,818 5 64,716,905 18 Other adjustments to stockholders’ equity
Intangible assets
Cumulative translation adjustments ( 1,066,766) ( 1) 1,490,885 -
Computer software and other intangible assets 153,738 - 737,912 - Net loss not recognized as pension cost 11 -( 3,202) -
Goodwill - - 962,876 - Unrealized gain or loss on financial instruments 1,197,335 1 2,159,201 1
Land use rights (Note 6) 213,331 - 2,618,687 1 Unrealized gains on cash flow hedges 200,655 - 306,361 -
367,069 - 4,319,475 1 106,043,660 52 173,183,977 47
Other assets
Minority interest 314,620 - 24,466,987 6
Leased assets (Notes 4(11) and 6) 137,316 - 882,127 1
Total stockholders
’ equity 106,358,280 52 197,650,964 53
Idle assets (Notes 4(12) and 6) - - 847,258 -
Refundable deposits (Note 6) 265,695 - 505,986 -
Deferred expenses 198,928 - 3,577,742 1
Other assets-others (Notes 4(22), 6 and 7) 1,268,167 1 4,061,702 1
1,870,106 1 9,874,815 3
TOTAL ASSETS
$ 202,893,883 100 $ 370,007,102 100 TOTAL LIABILITES AND STOCKHOLDERS’ EQUITY $ 202,893,883 100 $ 370,007,102 100
The accompanying notes are an integral part of these consolidated financial statements.
See report of independent accountants dated March 12, 2011.