Asus 2010 Annual Report Download - page 53
Download and view the complete annual report
Please find page 53 of the 2010 Asus annual report below. You can navigate through the pages in the report by either clicking on the pages listed below, or by using the keyword search tool below to find specific information within the annual report.-
 1
1 -
2
-
3
-
4
-
5
-
6
-
7
-
8
-
9
-
10
-
11
-
12
-
13
-
14
-
15
-
16
-
17
-
18
-
19
-
20
-
21
-
22
-
23
-
24
-
25
-
26
-
27
-
28
-
29
-
30
-
31
-
32
-
33
-
34
-
35
-
36
-
37
-
38
-
39
-
40
-
41
-
42
-
 43
43 -
 44
44 -
 45
45 -
 46
46 -
 47
47 -
 48
48 -
 49
49 -
 50
50 -
 51
51 -
 52
52 -
 53
53 -
 54
54 -
 55
55 -
 56
56 -
 57
57 -
 58
58 -
 59
59 -
 60
60 -
 61
61 -
 62
62 -
 63
63 -
64
-
65
-
66
-
67
-
68
-
69
-
70
-
71
-
72
-
73
-
74
-
75
-
76
-
77
-
78
-
79
-
80
-
81
-
82
-
83
-
84
-
85
-
86
-
87
-
88
-
89
-
90
-
91
-
92
-
93
-
94
-
95
-
96
-
97
-
98
-
99
-
100
-
101
-
102
-
103
-
104
-
105
-
106
-
107
-
108
-
109
-
110
-
111
-
112
-
113
-
114
-
115
-
116
-
117
-
118
-
119
-
120
-
121
-
122
-
123
-
124
-
125
-
126
-
127
-
128
-
129
-
130
-
131
-
132
-
133
-
134
-
135
-
136
-
137
-
138
-
139
-
140
-
141
-
142
-
143
-
144
-
145
-
146
-
147
-
148
-
149
-
150
-
151
-
152
-
153
-
154
-
155
-
156
-
157
-
158
-
159
-
160
-
161
-
162
-
163
-
164
-
165
-
166
-
167
-
168
-
169
-
170
-
171
-
172
-
173
-
174
-
175
-
176
-
177
-
178
-
179
-
180
-
181
-
182
-
183
-
184
-
185
-
186
-
187
-
188
-
189
-
190
-
191
-
192
-
193
-
194
-
195
-
196
-
197
-
198
-
199
-
200
-
201
-
202
-
203
-
204
-
205
-
206
-
207
-
208
-
209
-
210
-
211
 |
 |

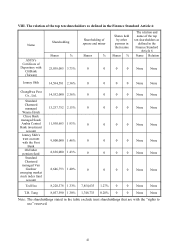
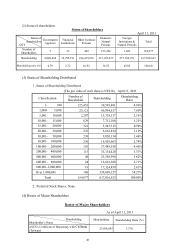
49
Shareholding
Shareholder’s Name
Shareholding Shareholding Ratio (%)
Jonney Shih 14,584,581 2.36%
Chunghwa Post Co., Ltd. 14,552,000 2.36%
Standard Chartered managed
Wayne Hsieh 13,237,752 2.15%
Chase Bank managed Saudi Arabia Central Bank
investment account 11,930,683 1.93%
Jonney Shih’s trust account with the First Bank 9,000,000 1.46%
Old labor pension fund 8,838,000 1.43%
Standard Chartered managed Van Gardner
emerging market stock index fund account 8,646,753 1.40%
Ted Hsu 8,228,378 1.33%
T.H. Tung 8,037,590 1.99%
Note: The shareholdings stated in the table exclude trust shareholdings that are with the “rights to
use” reserved.
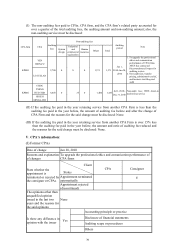
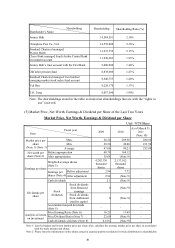
(5) Market Price, Net Worth, Earnings & Dividend per Share of the Last Two Years
Market Price, Net Worth, Earnings & Dividend per Share
Unit: NT$/Share
Fiscal year
Item 2009 2010
As of March 31,
2011
(Note 10)
Market price per
share
(Note 1) (Note 3)
Max. 66.50 289.50 280.50
Min. 29.50 49.00 231.50
Average 47.66 90.23 255.89
Net worth per
share (Note 2)
Before appropriation 40.78 169.12 -
After appropriation 38.68 (Note 9)
Earnings per share
Weighted average shares
(Note 3)
4,242,156
thousand
shares
2,137,012
thousand
shares
-
Earnings per
shares (Note 4)
Before adjustment 2.94 7.72 -
After adjustment 2.94 (Note 9)
Dividends per
share
Cash dividends 2.1 (Note 9) -
Stock
dividends
Stock dividends
from Retained
earnings
0 (Note 9) -
Stock dividends
from Additional
paid-in capital
0 (Note 9) -
Accumulated unpaid dividends
(Note 5) - - -
Analysis of return
on investment
Price/Earning Ratio (Note 6) 16.21 11.69 -
Price/Dividend Ratio (Note 7) 22.69 (Note 9) -
Cash dividends yield rate (Note 8) 4.41% (Note 9) -
Note 1: List the highest and lowest market price per share; also, calculate the average market price per share in accordance
with the trade amount and shares.
Note 2: Please base the information on the shares issued at yearned and the resolution for stock distribution in shareholders