Asus 2010 Annual Report Download - page 157
Download and view the complete annual report
Please find page 157 of the 2010 Asus annual report below. You can navigate through the pages in the report by either clicking on the pages listed below, or by using the keyword search tool below to find specific information within the annual report.-
 1
1 -
2
-
3
-
4
-
5
-
6
-
7
-
8
-
9
-
10
-
11
-
12
-
13
-
14
-
15
-
16
-
17
-
18
-
19
-
20
-
21
-
22
-
23
-
24
-
25
-
26
-
27
-
28
-
29
-
30
-
31
-
32
-
33
-
34
-
35
-
36
-
37
-
38
-
39
-
40
-
41
-
42
-
43
-
44
-
45
-
46
-
47
-
48
-
49
-
50
-
51
-
52
-
53
-
54
-
55
-
56
-
57
-
58
-
59
-
60
-
61
-
62
-
63
-
64
-
65
-
66
-
67
-
68
-
69
-
70
-
71
-
72
-
73
-
74
-
75
-
76
-
77
-
78
-
79
-
80
-
81
-
82
-
83
-
84
-
85
-
86
-
87
-
88
-
89
-
90
-
91
-
92
-
93
-
94
-
95
-
96
-
97
-
98
-
99
-
100
-
101
-
102
-
103
-
104
-
105
-
106
-
107
-
108
-
109
-
110
-
111
-
112
-
113
-
114
-
115
-
116
-
117
-
118
-
119
-
120
-
121
-
122
-
123
-
124
-
125
-
126
-
127
-
128
-
129
-
130
-
131
-
132
-
133
-
134
-
135
-
136
-
137
-
138
-
139
-
140
-
141
-
142
-
143
-
144
-
145
-
146
-
 147
147 -
 148
148 -
 149
149 -
 150
150 -
 151
151 -
 152
152 -
 153
153 -
 154
154 -
 155
155 -
 156
156 -
 157
157 -
 158
158 -
 159
159 -
 160
160 -
 161
161 -
 162
162 -
 163
163 -
 164
164 -
 165
165 -
 166
166 -
 167
167 -
168
-
169
-
170
-
171
-
172
-
173
-
174
-
175
-
176
-
177
-
178
-
179
-
180
-
181
-
182
-
183
-
184
-
185
-
186
-
187
-
188
-
189
-
190
-
191
-
192
-
193
-
194
-
195
-
196
-
197
-
198
-
199
-
200
-
201
-
202
-
203
-
204
-
205
-
206
-
207
-
208
-
209
-
210
-
211
 |
 |

153
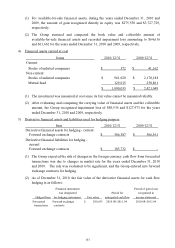
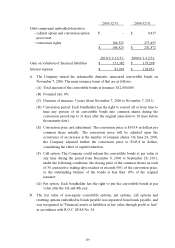
(1) For available-for-sale financial assets, during the years ended December 31, 2010 and
2009, the amount of gain recognized directly in equity was $275,550 and $3,727,729,
respectively.
(2) The Group assessed and compared the book value and collectible amount of
available-for-sale financial assets and recorded impairment loss amounting to $64,616
and $61,662 for the years ended December 31, 2010 and 2009, respectively.
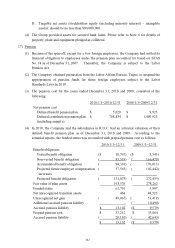
4) Financial assets carried at cost
Items 2010/12/31 2009/12/31
Current:
Stocks of unlisted companies $ 372 $ 41,162
Non-current:
Stocks of unlisted companies $ 961,020 $ 2,170,188
Mutual fund 129,015 250,861
$ 1,090,035 $ 2,421,049
(1) The investment was measured at cost since its fair value cannot be measured reliably.
(2) After evaluating and comparing the carrying value of financial assets and the collectible
amount, the Group recognized impairment loss of $89,536 and $127,973 for the years
ended December 31, 2010 and 2009, respectively.
5) Derivative financial assets and liabilities used for hedging purpose
Item
2010/
12
/3
1
2009/
12
/3
1
Derivative financial assets for hedging - current:
Forward exchange contracts $ 386,387 $ 306,361
Derivative financial liabilities for hedging -
current:
Forward exchange contracts $ 185,732 $ -
(1) The Group expected the risk of changes in the foreign currency cash flow from forecasted
transactions was due to changes in market rate for the years ended December 31, 2010
and 2009. The risk was evaluated to be significant, and the Group entered into forward
exchange contracts for hedging.
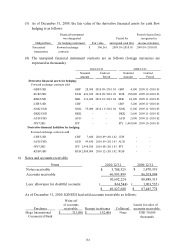
(2) As of December 31, 2010, the fair value of the derivative financial assets for cash flow
hedging is as follows:
Financial instrument
was designated Period for
Period of gain (loss)
recognized in
Hedged Item for hedging instrument Fair value anticipated cash flow income statement
Forecasted
transactions
Forward exchange
contracts
$ 200,655 2010.08~2011.04 2010.08~2011.04