Asus 2010 Annual Report Download - page 133
Download and view the complete annual report
Please find page 133 of the 2010 Asus annual report below. You can navigate through the pages in the report by either clicking on the pages listed below, or by using the keyword search tool below to find specific information within the annual report.
129
7
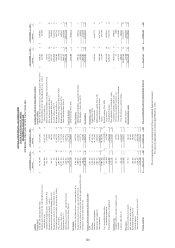
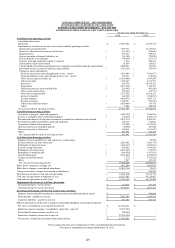
ASUSTeK COMPUTER INC. AND SUBSIDIARIES
CONSOLIDATED STATEMENTS OF CASH FLOWS
FOR THE YEARS ENDED DECEMBER 31, 2010 AND 2009
(EXPRESSED IN THOUSANDS OF NEW TAIWAN DOLLARS)
For the years ended December 31,
2010 2009
Cash flows from operating activities
Consol
idated
net income
Net income
$
18,039,603
$
16,255,535
Adjustments to reconcile net income to net cash provided by operating activities:
Depreciation and amortization
5,
597
,
473
13,
119
,
936
Reversal of allowance for inventory obsolescence
(
316
,
125
)
( 398,806)
Impairment loss
239,361
958,461
Gain on valuation of financial
liabilities
, net
( 151,382)
(
179,298)
Gain on disposal
of
investment
s
(
540
,
364
)
(
567
,
197
)
Property, plant and equipment transfer to expenses
3
,
566
520
,
616
Amortization of discount on bonds
81,039
128,051
Cash dividends received from
long
-
term investee companies accounted for under the equity method
4,008,093
169,090
Investment income
account
for under the equity method
(
1,110,159)
( 332,956)
Changes in assets and liabilities:
Financial assets at fair value through profit or loss
-
current
4,315,909
(
7,688,477)
Financial liabilities at fair value through profit or loss
-
current
158,455
( 878,100)
Notes and accounts receivable
, net
(
16,830,806)
2,509,244
Other receivables
3,
105
,
645
2,533,997
Inventories
464
,
728
10,358,341
Prepayments
(
2,27
6
,
614
)
1,1
10
,
596
Deferred income tax assets and liabilities
( 234,543)
(
4
01
,
246
)
Other current assets
-
others
958
,
210
(4
39
,
776
)
Notes and accounts payable
2,
734
,
788
13,698,535
Income tax payable
( 442,723)
(
1,588,938)
Accrued expenses
8,660,
876
5,093,711
Receipts in advance
5,100,897
( 990,769)
Other current liabilities
-
others
(
6,029,609)
145,570
Others 5,606 388,712
Net cash provided by operating activities 25,541,924 53,524,832
Cash
flows from investing activities
Acquisition of property, plant
and
equipment
(
1,628,158)
(
7,844,366)
Increase in intangible assets and deferred expenses
( 13
0
,
334
)
(
2,62
3
,
153
)
Proceeds from disposal
of long
-
term investments accounted for under the equity method
2,
075
,
970
2
,
429
,
591
Proceeds from disposal of property, plant and equipment
303
,
178
4
18
,
820
Acquisition of funds and investments
(1
72
,
424
)
(
1
,6
39
,
421
)
(In
crease
) de
crease
in refundable deposits
( 50,898)
407,040
De
creas
e (in
crease
)
in other assets
150,61
1
(
3,635,627)
Others 103,096 303,328
Net cash provided by (used in) investing activities 651,041 (12,183,788)
Cash flows from financing activities
Employee bonuses and directors’ and supervisors’ remuneration
-
( 70,958)
Increase (decrease) in short
-
term loans
2,286,302
(
2,082,754)
Redemption of long
-
term loans
(
1,128,667)
(
3,243,466)
Increase in long
-
term loans
850,102
1,698,826
Redemption of treasury stock
(
2,321,248)
(
873,459)
Redemption of bonds payable
(
1,346,450)
(
9,147,365)
Cash dividends paid
(
8,918,232)
(
8,439,852)
Changes in minority interest
1,178
(
1,913,241)
Others 7,327 165,432
Net cash used in financing activities ( 10,569,688) ( 23,906,837)
Effect due to changes in exchange rate
(1,053,209) ( 1,091,395)
Effect due to change in consolidated subsidiaries
(39,076,730) ( 72,657)
Change in cash due to change in ownership of subsidiaries
-264,580
Net (decrease) increase in cash and cash equivalents
(
24,506,662)
16,534,735
Cash and cash equivalents at beginning of
year 66,253,202 49,718,467
Cash and cash equivalents at end of year
$
41,746,540
$
66,253,202
Supplemental disclosures of cash flow information
Cash paid during the year for interest
$
127
,
863
$
391,270
Cash paid during the year for income tax
$
3
,
770
,
913
$
5,017,356
Investing and financing activities that result in non
-
cash flows:
Employee bonuses payable transferred to common stock and additional paid
-
in capital
$
-
$ 700,000
Bonds payable
-
payable in one year
$
2,412,309
$
3,609,633
Long
-
term liabilities
-
payable in one year
$ 291,300
$ 837,772
Effect on statement of cash flow due to change in consolidated subsidiaries on record date of spin
-
off
Net assets of subsidiaries on record date of spin
-
off
$119,504,391
$
-
Reduction of parent company’s stockholder’s equity due to spin
-
off
(70,197,726)
-
Reclassified to financial assets carried at cost
( 202,660)
-
Reduction of minority interest due to spin
-
off
(25,704,764)
-
Net increase of long
-
term investment under equity method
$
23,399,241
$
-
The accompanying notes are an integral part of these consolidated financial statements.
See report of independent accountants dated March 12, 2011.


