Asus 2010 Annual Report Download - page 104
Download and view the complete annual report
Please find page 104 of the 2010 Asus annual report below. You can navigate through the pages in the report by either clicking on the pages listed below, or by using the keyword search tool below to find specific information within the annual report.-
 1
1 -
2
-
3
-
4
-
5
-
6
-
7
-
8
-
9
-
10
-
11
-
12
-
13
-
14
-
15
-
16
-
17
-
18
-
19
-
20
-
21
-
22
-
23
-
24
-
25
-
26
-
27
-
28
-
29
-
30
-
31
-
32
-
33
-
34
-
35
-
36
-
37
-
38
-
39
-
40
-
41
-
42
-
43
-
44
-
45
-
46
-
47
-
48
-
49
-
50
-
51
-
52
-
53
-
54
-
55
-
56
-
57
-
58
-
59
-
60
-
61
-
62
-
63
-
64
-
65
-
66
-
67
-
68
-
69
-
70
-
71
-
72
-
73
-
74
-
75
-
76
-
77
-
78
-
79
-
80
-
81
-
82
-
83
-
84
-
85
-
86
-
87
-
88
-
89
-
90
-
91
-
92
-
93
-
 94
94 -
 95
95 -
 96
96 -
 97
97 -
 98
98 -
 99
99 -
 100
100 -
 101
101 -
 102
102 -
 103
103 -
 104
104 -
 105
105 -
 106
106 -
 107
107 -
 108
108 -
 109
109 -
 110
110 -
 111
111 -
 112
112 -
 113
113 -
 114
114 -
115
-
116
-
117
-
118
-
119
-
120
-
121
-
122
-
123
-
124
-
125
-
126
-
127
-
128
-
129
-
130
-
131
-
132
-
133
-
134
-
135
-
136
-
137
-
138
-
139
-
140
-
141
-
142
-
143
-
144
-
145
-
146
-
147
-
148
-
149
-
150
-
151
-
152
-
153
-
154
-
155
-
156
-
157
-
158
-
159
-
160
-
161
-
162
-
163
-
164
-
165
-
166
-
167
-
168
-
169
-
170
-
171
-
172
-
173
-
174
-
175
-
176
-
177
-
178
-
179
-
180
-
181
-
182
-
183
-
184
-
185
-
186
-
187
-
188
-
189
-
190
-
191
-
192
-
193
-
194
-
195
-
196
-
197
-
198
-
199
-
200
-
201
-
202
-
203
-
204
-
205
-
206
-
207
-
208
-
209
-
210
-
211
 |
 |

100
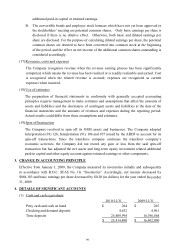
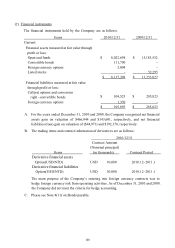
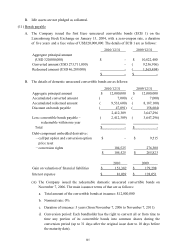
(2) Financial instruments
The financial instruments held by the Company are as follows:
Items 2010/12/31 2009/12/31
Current:
Financial assets measured at fair value through
profit or loss:
Open-end funds $ 8,022,694 $ 13,183,532
Convertible bonds 111,700 -
Foreign currency options 3,004 -
Listed stocks -52,295
$ 8,137,398 $ 13,253,827
Financial liabilities measured at fair value
through profit or loss:
Call/put options and conversion
right –convertible bonds $ 104,525 $ 285,823
Foreign currency options 1,370 -
$ 105,895 $ 285,823
A. For the years ended December 31, 2010 and 2009, the Company recognized net financial
assets gain on valuation of $466,044 and $143,601, respectively, and net financial
liabilities (loss) gain on valuation of ($44,971) and $192,378, respectively.
B. The trading items and contract information of derivatives are as follows:
2010/12/31
Items
Contract Amount
(Nominal principal)
(in thousands) Contract Period
Derivative financial assets
Option(USD/NTD) USD 10,000 2010.12~2011.1
Derivative financial liabilities
Option(USD/NTD) USD 30,000 2010.12~2011.1
The main purpose of the Company’s entering into foreign currency contracts was to
hedge foreign currency risk from operating activities. As of December 31, 2010 and 2009,
the Company did not meet the criteria for hedge accounting.
C. Please see Note 4(11) on Bonds payable.