Asus 2010 Annual Report Download - page 117
Download and view the complete annual report
Please find page 117 of the 2010 Asus annual report below. You can navigate through the pages in the report by either clicking on the pages listed below, or by using the keyword search tool below to find specific information within the annual report.-
 1
1 -
2
-
3
-
4
-
5
-
6
-
7
-
8
-
9
-
10
-
11
-
12
-
13
-
14
-
15
-
16
-
17
-
18
-
19
-
20
-
21
-
22
-
23
-
24
-
25
-
26
-
27
-
28
-
29
-
30
-
31
-
32
-
33
-
34
-
35
-
36
-
37
-
38
-
39
-
40
-
41
-
42
-
43
-
44
-
45
-
46
-
47
-
48
-
49
-
50
-
51
-
52
-
53
-
54
-
55
-
56
-
57
-
58
-
59
-
60
-
61
-
62
-
63
-
64
-
65
-
66
-
67
-
68
-
69
-
70
-
71
-
72
-
73
-
74
-
75
-
76
-
77
-
78
-
79
-
80
-
81
-
82
-
83
-
84
-
85
-
86
-
87
-
88
-
89
-
90
-
91
-
92
-
93
-
94
-
95
-
96
-
97
-
98
-
99
-
100
-
101
-
102
-
103
-
104
-
105
-
106
-
 107
107 -
 108
108 -
 109
109 -
 110
110 -
 111
111 -
 112
112 -
 113
113 -
 114
114 -
 115
115 -
 116
116 -
 117
117 -
 118
118 -
 119
119 -
 120
120 -
 121
121 -
 122
122 -
 123
123 -
 124
124 -
 125
125 -
 126
126 -
 127
127 -
128
-
129
-
130
-
131
-
132
-
133
-
134
-
135
-
136
-
137
-
138
-
139
-
140
-
141
-
142
-
143
-
144
-
145
-
146
-
147
-
148
-
149
-
150
-
151
-
152
-
153
-
154
-
155
-
156
-
157
-
158
-
159
-
160
-
161
-
162
-
163
-
164
-
165
-
166
-
167
-
168
-
169
-
170
-
171
-
172
-
173
-
174
-
175
-
176
-
177
-
178
-
179
-
180
-
181
-
182
-
183
-
184
-
185
-
186
-
187
-
188
-
189
-
190
-
191
-
192
-
193
-
194
-
195
-
196
-
197
-
198
-
199
-
200
-
201
-
202
-
203
-
204
-
205
-
206
-
207
-
208
-
209
-
210
-
211
 |
 |

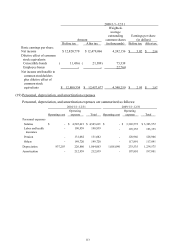
113
2009/1/1~12/31
Weighted-
average
outstanding Earnings per share
Amount common shares (in dollars)
Before tax After tax (in thousands) Before tax After tax
Basic earnings per share:
Net income $ 12,820,770 $ 12,479,066 4,242,156 $ 3.02 $2.94
Dilutive effect of common
stock equivalents:
Convertible bonds ( 11,436) ( 21,389) 75,339
Employee bonus --22,764
Net income attributable to
common stockholders
plus dilutive effect of
common stock
equivalents $ 12,809,334 $ 12,457,677 4,340,259 $ 2.95 $2.87
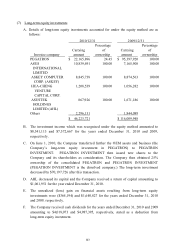
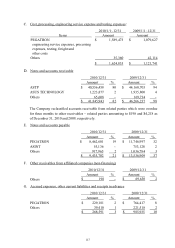
(19) Personnel, depreciation, and amortization expenses
Personnel, depreciation, and amortization expenses are summarized as follows:
2010/1/1~12/31 2009/1/1~12/31
Operating Operating
Operating cost expense Total Operating cost expense Total
Personnel expenses
Salaries $ - $ 4,545,621 $4,545,621 $ -$ 3,303,572 $3,303,572
Labor and health
insurance
-190,939 190,939 -193,355 193,355
Pension - 131,082 131,082 -128,966 128,966
Others - 149,720 149,720 -117,891 117,891
Depreciation 837,203 226,860 1,064,063 1,001,040 233,535 1,234,575
Amortization - 212,939 212,939 -197,801 197,801