Asus 2010 Annual Report Download - page 190
Download and view the complete annual report
Please find page 190 of the 2010 Asus annual report below. You can navigate through the pages in the report by either clicking on the pages listed below, or by using the keyword search tool below to find specific information within the annual report.-
 1
1 -
2
-
3
-
4
-
5
-
6
-
7
-
8
-
9
-
10
-
11
-
12
-
13
-
14
-
15
-
16
-
17
-
18
-
19
-
20
-
21
-
22
-
23
-
24
-
25
-
26
-
27
-
28
-
29
-
30
-
31
-
32
-
33
-
34
-
35
-
36
-
37
-
38
-
39
-
40
-
41
-
42
-
43
-
44
-
45
-
46
-
47
-
48
-
49
-
50
-
51
-
52
-
53
-
54
-
55
-
56
-
57
-
58
-
59
-
60
-
61
-
62
-
63
-
64
-
65
-
66
-
67
-
68
-
69
-
70
-
71
-
72
-
73
-
74
-
75
-
76
-
77
-
78
-
79
-
80
-
81
-
82
-
83
-
84
-
85
-
86
-
87
-
88
-
89
-
90
-
91
-
92
-
93
-
94
-
95
-
96
-
97
-
98
-
99
-
100
-
101
-
102
-
103
-
104
-
105
-
106
-
107
-
108
-
109
-
110
-
111
-
112
-
113
-
114
-
115
-
116
-
117
-
118
-
119
-
120
-
121
-
122
-
123
-
124
-
125
-
126
-
127
-
128
-
129
-
130
-
131
-
132
-
133
-
134
-
135
-
136
-
137
-
138
-
139
-
140
-
141
-
142
-
143
-
144
-
145
-
146
-
147
-
148
-
149
-
150
-
151
-
152
-
153
-
154
-
155
-
156
-
157
-
158
-
159
-
160
-
161
-
162
-
163
-
164
-
165
-
166
-
167
-
168
-
169
-
170
-
171
-
172
-
173
-
174
-
175
-
176
-
177
-
178
-
179
-
 180
180 -
 181
181 -
 182
182 -
 183
183 -
 184
184 -
 185
185 -
 186
186 -
 187
187 -
 188
188 -
 189
189 -
 190
190 -
 191
191 -
 192
192 -
 193
193 -
 194
194 -
 195
195 -
 196
196 -
 197
197 -
 198
198 -
 199
199 -
 200
200 -
201
-
202
-
203
-
204
-
205
-
206
-
207
-
208
-
209
-
210
-
211
 |
 |
186
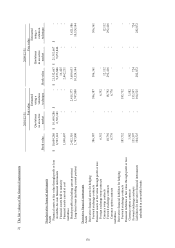
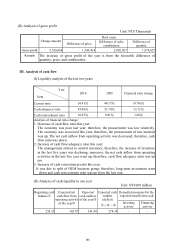
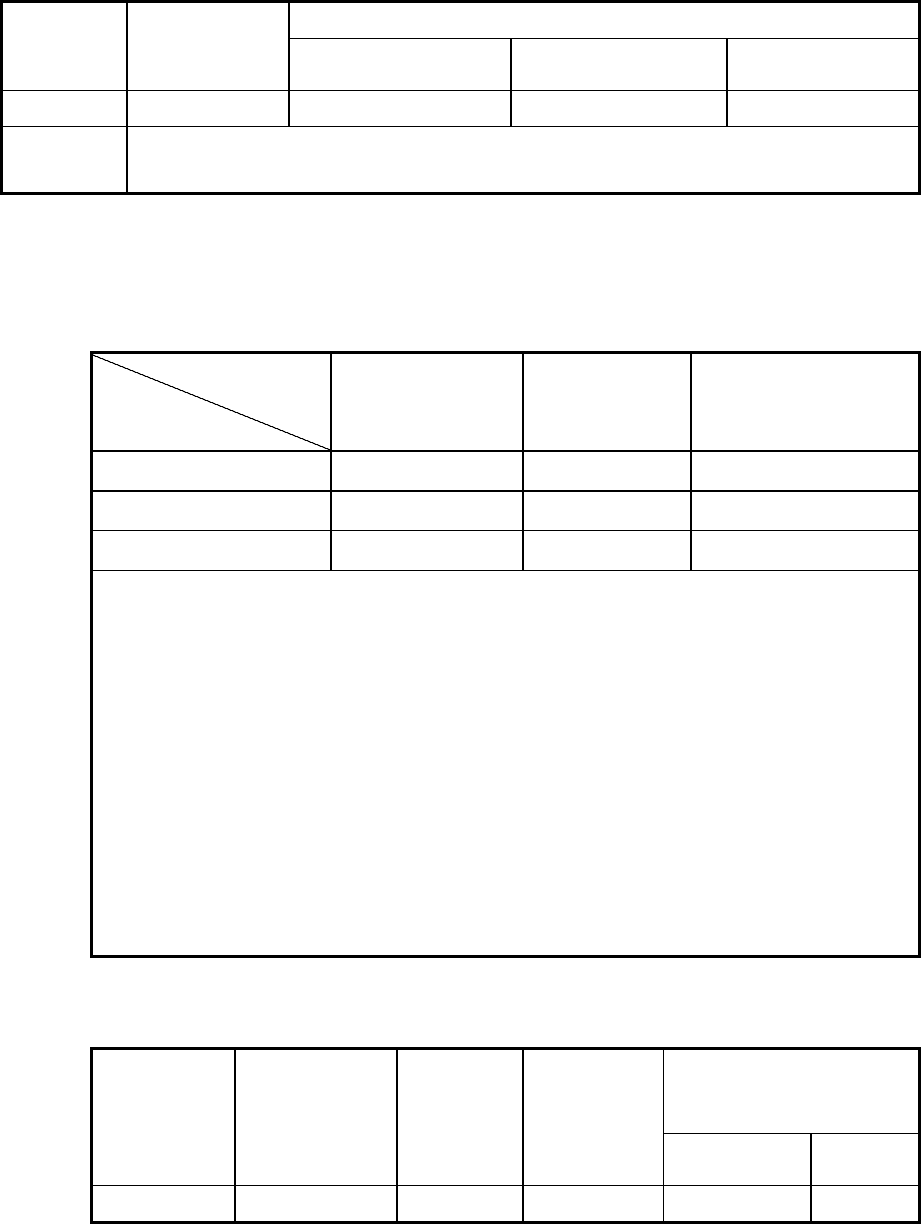
(II) Analysis of gross profit
Unit: NT$ Thousands
Change amount
Root cause
Difference of price Difference of sales
combination
Difference of
quantity
Gross profit 5,526,068 1,545,414 2,002,027 1,978,627
Remark The increase of gross profit of the year is from the favorable difference o
f
quantity, price, and combination.
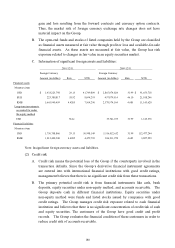
III. Analysis of cash flow
(I) Liquidity analysis of the last two years
Year
Item
2010 2009 Financial ratio change
Current ratio 36.41% 46.17% (9.76)%
Cash adequacy ratio 85.46% 51.74% 33.72%
Cash reinvestment ratio 10.87% 9.01% 1.86%
Analysis of financial ratio change:
1. Decrease of cash flow ratio this year:
The economy was poor last year; therefore, the procurement was low relatively.
The economy was recovered this year; therefore, the procurement of raw material
was up. The net cash inflow from operating activity was decreased; therefore, cash
flow ratio was down.
2. Increase of cash flow adequacy ratio this year:
The management strived to control inventory; therefore, the increase of inventory
in the last five years was declining; moreover, the net cash inflow from operating
activities in the last five year went up; therefore, cash flow adequacy ratio was up
too.
3. Increase of cash reinvestment ratio this year:
It was due to split of OEM business group; therefore, long-term investment went
down and cash reinvestment ratio was up from the last year.
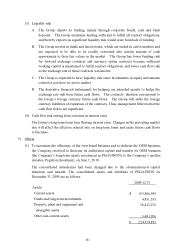
(II) Analysis of cash liquidity in one year
Unit: NT$100 million
Beginning cash
balance
Expected net
cash flow from
operating activity
of the year
Expected
cash outflow
of the year
Expected cash
surplus
(deficit)
+-
Remedial measures for the
expected insufficient cash
Investing
activity
Financing
activity
254.15 165.87 141.88 278.14 - -