Asus 2010 Annual Report Download - page 155
Download and view the complete annual report
Please find page 155 of the 2010 Asus annual report below. You can navigate through the pages in the report by either clicking on the pages listed below, or by using the keyword search tool below to find specific information within the annual report.-
 1
1 -
2
-
3
-
4
-
5
-
6
-
7
-
8
-
9
-
10
-
11
-
12
-
13
-
14
-
15
-
16
-
17
-
18
-
19
-
20
-
21
-
22
-
23
-
24
-
25
-
26
-
27
-
28
-
29
-
30
-
31
-
32
-
33
-
34
-
35
-
36
-
37
-
38
-
39
-
40
-
41
-
42
-
43
-
44
-
45
-
46
-
47
-
48
-
49
-
50
-
51
-
52
-
53
-
54
-
55
-
56
-
57
-
58
-
59
-
60
-
61
-
62
-
63
-
64
-
65
-
66
-
67
-
68
-
69
-
70
-
71
-
72
-
73
-
74
-
75
-
76
-
77
-
78
-
79
-
80
-
81
-
82
-
83
-
84
-
85
-
86
-
87
-
88
-
89
-
90
-
91
-
92
-
93
-
94
-
95
-
96
-
97
-
98
-
99
-
100
-
101
-
102
-
103
-
104
-
105
-
106
-
107
-
108
-
109
-
110
-
111
-
112
-
113
-
114
-
115
-
116
-
117
-
118
-
119
-
120
-
121
-
122
-
123
-
124
-
125
-
126
-
127
-
128
-
129
-
130
-
131
-
132
-
133
-
134
-
135
-
136
-
137
-
138
-
139
-
140
-
141
-
142
-
143
-
144
-
 145
145 -
 146
146 -
 147
147 -
 148
148 -
 149
149 -
 150
150 -
 151
151 -
 152
152 -
 153
153 -
 154
154 -
 155
155 -
 156
156 -
 157
157 -
 158
158 -
 159
159 -
 160
160 -
 161
161 -
 162
162 -
 163
163 -
 164
164 -
 165
165 -
166
-
167
-
168
-
169
-
170
-
171
-
172
-
173
-
174
-
175
-
176
-
177
-
178
-
179
-
180
-
181
-
182
-
183
-
184
-
185
-
186
-
187
-
188
-
189
-
190
-
191
-
192
-
193
-
194
-
195
-
196
-
197
-
198
-
199
-
200
-
201
-
202
-
203
-
204
-
205
-
206
-
207
-
208
-
209
-
210
-
211
 |
 |

151
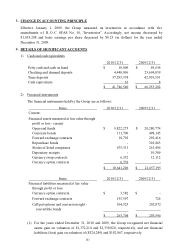
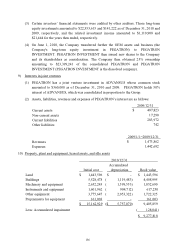
3. CHANGE IN ACCOUNTING PRINCIPLE
Effective January 1, 2009, the Group measured its inventories in accordance with the
amendments o f R . O . C SFAS No. 10, “Inventories”. Accordingly, net income decreased by
$1,053,208 and basic earnings per share decreased by $0.25 (in dollars) for the year ended
December 31, 2009.
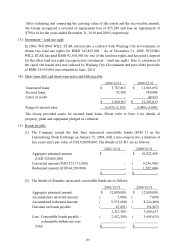
4. DETAILS OF SIGNIFICANT ACCOUNTS
1) Cash and cash equivalents
2010/12/31 2009/12/31
Petty cash and cash on hand $ 10,809 $ 49,634
Checking and demand deposits 4,440,096 23,694,059
Time deposits 37,295,574 42,509,501
Cash equivalents 61 8
$ 41,746,540 $ 66,253,202
2) Financial instruments
The financial instruments held by the Group are as follows:
Items 2010/12/31 2009/12/31
Current:
Financial assets measured at fair value through
profit or loss - current:
Open-end funds $ 9,822,275 $ 20,280,774
Corporate bonds 111,700 498,145
Forward exchange contracts 18,792 292,416
Repurchase bonds - 301,863
Stocks of listed companies 675,311 261,496
Depositary receipts - 10,389
Currency swap contracts 6,352 12,112
Currency option contracts 6,776 -
$ 10,641,206 $ 21,657,195
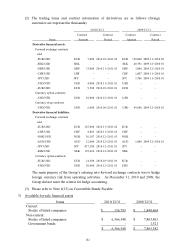
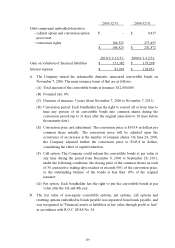
Items 2010/12/31 2009/12/31
Financial liabilities measured at fair value
through profit or loss:
Currency option contracts $ 3,582 $ -
Forward exchange contracts 155,597 724
Call/put options and conversion right -
convertible bonds
104,525 282,872
$ 263,704 $ 283,596
(1) For the years ended December 31, 2010 and 2009, the Group recognized net financial
assets gain on valuation of $1,372,218 and $1,339,020, respectively, and net financial
liabilities (loss) gain on valuation of ($324,249) and $192,867, respectively.