Xerox 2002 Annual Report Download - page 97
Download and view the complete annual report
Please find page 97 of the 2002 Xerox annual report below. You can navigate through the pages in the report by either clicking on the pages listed below, or by using the keyword search tool below to find specific information within the annual report.-
 1
1 -
2
-
3
-
4
-
5
-
6
-
7
-
8
-
9
-
10
-
11
-
12
-
13
-
14
-
15
-
16
-
17
-
18
-
19
-
20
-
21
-
22
-
23
-
24
-
25
-
26
-
27
-
28
-
29
-
30
-
31
-
32
-
33
-
34
-
35
-
36
-
37
-
38
-
39
-
40
-
41
-
42
-
43
-
44
-
45
-
46
-
47
-
48
-
49
-
50
-
51
-
52
-
53
-
54
-
55
-
56
-
57
-
58
-
59
-
60
-
61
-
62
-
63
-
64
-
65
-
66
-
67
-
68
-
69
-
70
-
71
-
72
-
73
-
74
-
75
-
76
-
77
-
78
-
79
-
80
-
81
-
82
-
83
-
84
-
85
-
86
-
 87
87 -
 88
88 -
 89
89 -
 90
90 -
 91
91 -
 92
92 -
 93
93 -
 94
94 -
 95
95 -
 96
96 -
 97
97 -
 98
98 -
 99
99 -
 100
100
 |
 |

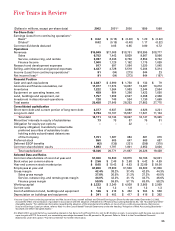
Five Years in Review
(Dollars in millions, except per-share data) 2002 2001(2) 2000 1999 1998
Per-Share Data(1)
Earnings (Loss) from continuing operations(1)
Basic(1) $0.02 $ (0.15) $ (0.48) $ 1.20 $ (0.32)
Diluted(1) 0.02 (0.15) (0.48) 1.17 (0.32)
Common dividends declared –0.05 0.65 0.80 0.72
Operations
Revenues $15,849 $17,008 $18,751 $18,995 $18,777
Sales 6,752 7,443 8,839 8,967 8,996
Service, outsourcing, and rentals 8,097 8,436 8,750 8,853 8,742
Finance Income 1,000 1,129 1,162 1,175 1,039
Research and development expenses 917 997 1,064 1,020 1,045
Selling, administrative and general expenses 4,437 4,728 5,518 5,204 5,314
Income (Loss) from continuing operations(1) 91 (94) (273) 844 23
Net income (loss)(1) 91 (94) (273) 844 (167)
Financial Position
Cash and cash equivalents $ 2,887 $ 3,990 $ 1,750 $ 132 $ 79
Accounts and finance receivables, net 11,077 11,574 13,067 13,487 13,272
Inventories 1,222 1,364 1,983 2,344 2,554
Equipment on operating leases, net 459 804 1,266 1,423 1,650
Land, buildings and equipment, net 1,757 1,999 2,527 2,458 2,366
Investment in discontinued operations 728 749 534 1,130 1,669
Total assets 25,458 27,645 28,253 27,803 27,775
Consolidated capitalization
Short-term debt and current portion of long-term debt 4,377 6,637 3,080 4,626 4,221
Long-term debt 9,794 10,107 15,557 11,521 11,104
Total debt 14,171 16,744 18,637 16,147 15,325
Minorities’ interests in equity of subsidiaries 73 73 87 75 81
Obligation for equity put options –– 32 – –
Company-obligated, mandatorily redeemable
preferred securities of subsidiary trusts
holding solely subordinated debentures
of the Company 1,701 1,687 684 681 679
Preferred stock 550 605 647 669 687
Deferred ESOP benefits (42) (135) (221) (299) (370)
Common shareholders’ equity 1,893 1,797 1,801 2,953 3,026
Total capitalization 18,346 20,771 21,667 20,226 19,428
Selected Data and Ratios
Common shareholders of record at year-end 57,300 59,830 59,879 55,766 52,001
Book value per common share $2.56 $ 2.49 $ 2.68 $ 4.42 $ 4.59
Year-end common stock market price $8.05 $ 10.42 $ 4.63 $ 22.69 $ 59.00
Employees at year-end 67,800 78,900 91,500 93,600 91,800
Gross margin 42.4% 38.2% 37.4% 42.3% 44.3%
Sales gross margin 37.8% 30.5% 31.2% 37.2% 40.5%
Service, outsourcing, and rentals gross margin 44.0% 42.2% 41.1% 44.7% 46.6%
Finance gross margin 59.9% 59.5% 57.1% 63.0% 58.2%
Working capital $ 3,232 $ 2,340 $ 4,928 $ 2,965 $ 2,959
Current ratio 1.4 1.2 1.8 1.3 1.3
Cost of additions to land, buildings and equipment $ 146 $ 219 $ 452 $ 594 $ 566
Depreciation on buildings and equipment $ 341 $ 402 $ 417 $ 416 $ 362
1 Income (Loss) from continuing operations and Net income (loss), as well as Basic and Diluted Earnings per Share for the year ended December 31, 2002,
exclude the effect of amortization of goodwill in accordance with the adoption of Statement of Financial Accounting Standards No. 142 “Goodwill and Other
Intangible Assets.” For additional information regarding the adoption of this standard and its effects on Income from continuing operations, Net income
(loss) and Earnings (Loss) per share, refer to Note 1 to the Consolidated Financial Statements under the heading “Adoption of New Accounting Standards –
Goodwill and Other Intangible Assets.”
2 In March 2001, we sold half of our ownership interest in Fuji Xerox to Fuji Photo Film Co. Ltd. for $1.3 billion in cash. In connection with the sale, we recorded
a pre-tax gain of $773. As a result, our ownership percentage decreased from 50 percent to 25 percent. Refer to Note 4 to the Consolidated Financial
Statements under the caption “Fuji Xerox Interest” for further information.
95