Xerox 2002 Annual Report Download - page 21
Download and view the complete annual report
Please find page 21 of the 2002 Xerox annual report below. You can navigate through the pages in the report by either clicking on the pages listed below, or by using the keyword search tool below to find specific information within the annual report.-
 1
1 -
2
-
3
-
4
-
5
-
6
-
7
-
8
-
9
-
10
-
 11
11 -
 12
12 -
 13
13 -
 14
14 -
 15
15 -
 16
16 -
 17
17 -
 18
18 -
 19
19 -
 20
20 -
 21
21 -
 22
22 -
 23
23 -
 24
24 -
 25
25 -
 26
26 -
 27
27 -
 28
28 -
 29
29 -
 30
30 -
 31
31 -
32
-
33
-
34
-
35
-
36
-
37
-
38
-
39
-
40
-
41
-
42
-
43
-
44
-
45
-
46
-
47
-
48
-
49
-
50
-
51
-
52
-
53
-
54
-
55
-
56
-
57
-
58
-
59
-
60
-
61
-
62
-
63
-
64
-
65
-
66
-
67
-
68
-
69
-
70
-
71
-
72
-
73
-
74
-
75
-
76
-
77
-
78
-
79
-
80
-
81
-
82
-
83
-
84
-
85
-
86
-
87
-
88
-
89
-
90
-
91
-
92
-
93
-
94
-
95
-
96
-
97
-
98
-
99
-
100
 |
 |

19
Finance income is primarily impacted by equipment
lease originations and interest rates. The most signifi-
cant factor is the level of equipment lease originations;
accordingly, we expect that Finance income will decline
in 2003, reflecting lower equipment lease originations
in recent years. In addition, Finance income will be
reduced to the extent we sell portions of our financing
businesses, similar to the Nordic countries and Italy, or
enter into agreements with third-parties to provide
financing directly to our customers. Since the vast
majority of our third-party financing arrangements
have been structured as secured borrowings, the lease
receivables remain on our balance sheet and are
expected to continue generating Finance income. As a
result of the above factors, we expect the trend of the
decreasing Finance income to stabilize, although peri-
odic fluctuations will occur as a result of the level of
equipment sales and interest rates.
We expect equipment sales to grow modestly in
2003, as our 2002 and planned 2003 product launches
should enable us to strengthen our market position. Our
ability to increase post sale revenue is dependent on
our success increasing the amount of our equipment at
customer locations and the volume of pages generated
on that equipment. In 2003, we expect post sale and
other revenue declines will continue to moderate as
equipment sales increase and our services and solu-
tions increase utilization of the equipment. Accordingly,
we expect a modest total revenue decline in 2003.
Employee Stock Ownership Plan: As more fully
discussed in Note 16 to the Consolidated Financial
Statements, our Board of Directors reinstated the
dividend on our Employee Stock Ownership Plan
(“ESOP”) in 2002, which resulted in a reversal of com-
pensation expense previously recorded. The reversal
of compensation expense corresponded to the line
item in the Consolidated Statement of Income for
2002 where the charge was originally recorded and
included $28 million in both Cost of Sales and Selling,
administrative and general expenses and $11 million
in Research and Development expenses. Of the total
compensation expense originally recorded, $34 million
and $33 million was recognized in 2002 and 2001,
respectively. As such, 2002 benefited by $33 million
of excess compensation expense reversal that was
recorded in 2001. There is no corresponding earnings
per share improvement in 2002, since the EPS calcula-
tion requires deduction of dividends declared from
reported net income in arriving at net income avail-
able to common shareholders. In the fourth quarter
2002, an additional $11 million of dividends were
declared.
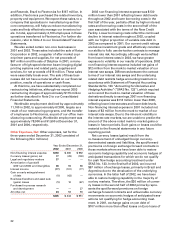
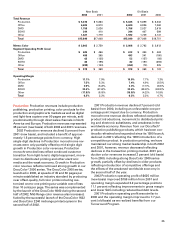
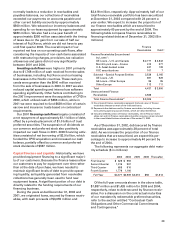
Gross Margin: Gross margin by revenue classification
was as follows:
Year Ended December 31,
2002 2001 2000
Total gross margin 42.4% 38.2% 37.4%
Sales 37.8% 30.5% 31.2%
Service, outsourcing
and rentals 44.0% 42.2% 41.1%
Finance income 59.9% 59.5% 57.1%
The 2002 gross margin of 42.4 percent improved
4.2 percentage points from 2001. 1.4 percentage
points of the increase reflects our second half 2001
SOHO exit. Improved manufacturing and service pro-
ductivity, which was more than offset by lower prices,
accounted for approximately one percentage point of
improvement and higher margins in our DMO operat-
ing segment and also contributed about 0.5 percent-
age point of the improvement. The balance of the
increase includes the favorable ESOP compensation
expense adjustment, favorable transaction currency,
lower inventory charges associated with restructuring
actions and improved document outsourcing margins
associated with our focus on profitable revenue.
2002 Sales gross margin improved by 7.3 percent-
age points from 2001. Approximately 2.6 percentage
points of the improvement was due to our SOHO exit,
about 1.3 percentage points of the improvement was
due to increases in DMO, 0.6 percentage point was
due to lower inventory charges associated with
restructuring actions and the balance was largely due
to manufacturing productivity, which was more than
offset by competitive price pressures. 2002 Service,
outsourcing and rentals margins improved by 1.8 per-
centage points from 2001 reflecting the benefits of
expense productivity actions and more profitable doc-
ument outsourcing contracts.
The 2001 gross margin of 38.2 percent increased
0.8 percentage point from 2000, as improved manu-
facturing and service productivity more than offset
unfavorable mix and competitive price pressures, par-
ticularly in the production monochrome area. 2001
Sales gross margin declined by 0.7 percentage points
due to higher manufacturing expenses resulting from
lower volume and plant utilization as well as a lower
level of high margin licensing and software revenues.
These improvements were partially offset by increased
margins in our printer business. 2001 Service, out-
sourcing and rentals margin improved by 1.1 percent-
age points due primarily to service expense reductions
and facilities maintenance gross margin improve-
ments, partially offset by declines in DMO.