Xerox 2002 Annual Report Download - page 93
Download and view the complete annual report
Please find page 93 of the 2002 Xerox annual report below. You can navigate through the pages in the report by either clicking on the pages listed below, or by using the keyword search tool below to find specific information within the annual report.-
 1
1 -
2
-
3
-
4
-
5
-
6
-
7
-
8
-
9
-
10
-
11
-
12
-
13
-
14
-
15
-
16
-
17
-
18
-
19
-
20
-
21
-
22
-
23
-
24
-
25
-
26
-
27
-
28
-
29
-
30
-
31
-
32
-
33
-
34
-
35
-
36
-
37
-
38
-
39
-
40
-
41
-
42
-
43
-
44
-
45
-
46
-
47
-
48
-
49
-
50
-
51
-
52
-
53
-
54
-
55
-
56
-
57
-
58
-
59
-
60
-
61
-
62
-
63
-
64
-
65
-
66
-
67
-
68
-
69
-
70
-
71
-
72
-
73
-
74
-
75
-
76
-
77
-
78
-
79
-
80
-
81
-
82
-
 83
83 -
 84
84 -
 85
85 -
 86
86 -
 87
87 -
 88
88 -
 89
89 -
 90
90 -
 91
91 -
 92
92 -
 93
93 -
 94
94 -
 95
95 -
 96
96 -
 97
97 -
 98
98 -
 99
99 -
 100
100
 |
 |

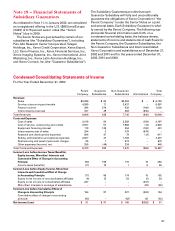
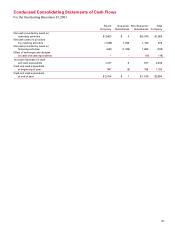
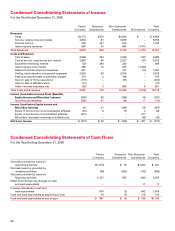
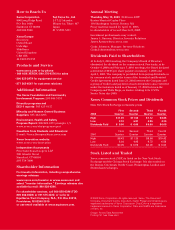
Condensed Consolidating Statements of Cash Flows
For the Year Ending December 31, 2001
Parent Guarantor Non-Guarantor Total
Company Subsidiaries Subsidiaries Company
Net cash provided by (used in)
operating activities $ 3,603 $ 4 $(2,041) $1,566
Net cash (used in) provided
by investing activities (1,545) 1,235 1,183 873
Net cash provided by (used in)
financing activities (641) (1,233) 1,685 (189)
Effect of exchange rate changes
on cash and cash equivalents – – (10) (10)
Increase (decrease) in cash
and cash equivalents 1,417 6 817 2,240
Cash and cash equivalents
at beginning of year 997 (5) 758 1,750
Cash and cash equivalents
at end of year $ 2,414 $ 1 $ 1,575 $3,990
91