Xerox 2002 Annual Report Download - page 74
Download and view the complete annual report
Please find page 74 of the 2002 Xerox annual report below. You can navigate through the pages in the report by either clicking on the pages listed below, or by using the keyword search tool below to find specific information within the annual report.-
 1
1 -
2
-
3
-
4
-
5
-
6
-
7
-
8
-
9
-
10
-
11
-
12
-
13
-
14
-
15
-
16
-
17
-
18
-
19
-
20
-
21
-
22
-
23
-
24
-
25
-
26
-
27
-
28
-
29
-
30
-
31
-
32
-
33
-
34
-
35
-
36
-
37
-
38
-
39
-
40
-
41
-
42
-
43
-
44
-
45
-
46
-
47
-
48
-
49
-
50
-
51
-
52
-
53
-
54
-
55
-
56
-
57
-
58
-
59
-
60
-
61
-
62
-
63
-
 64
64 -
 65
65 -
 66
66 -
 67
67 -
 68
68 -
 69
69 -
 70
70 -
 71
71 -
 72
72 -
 73
73 -
 74
74 -
 75
75 -
 76
76 -
 77
77 -
 78
78 -
 79
79 -
 80
80 -
 81
81 -
 82
82 -
 83
83 -
 84
84 -
85
-
86
-
87
-
88
-
89
-
90
-
91
-
92
-
93
-
94
-
95
-
96
-
97
-
98
-
99
-
100
 |
 |

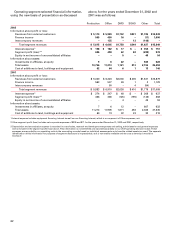
Our domestic retirement defined benefit plans pro-
vide employees a benefit at the greater of (i) the benefit
calculated under a highest average pay and years of
service formula, (ii) the benefit calculated under a
formula that provides for the accumulation of salary
Pension Benefits Other Benefits
2002 2001 2000 2002 2001 2000
Components of Net Periodic Benefit Cost
Defined benefit plans
Service cost $ 180 $ 174 $ 167 $ 26 $ 28 $24
Interest cost(1) (210) (184) 453 96 99 85
Expected return on plan assets(2) 134 81 (522) –– –
Recognized net actuarial loss 774 33–
Amortization of prior service cost 394 (5) – –
Recognized net transition asset (1) (14) (16) – – –
Recognized curtailment/settlement loss (gain) 55 26 (46) –– –
Net periodic benefit cost 168 99 44 120 130 109
Special termination benefits 27 – – 2– –
Defined contribution plans 10 21 14 –– –
Total $ 205 $ 120 $ 58 $122 $130 $109
1 Interest cost includes interest expense on non-TRA obligations of $238, $216 and $225 and interest (income) expense directly allocated to TRA participant
accounts of $(448), $(400) and $228 for the years ended December 31, 2002, 2001 and 2000, respectively.
2 Expected return on plan assets includes expected investment income on non-TRA assets of $314, $319 and $294 and actual investment (losses) income on
TRA assets of $(448), $(400) and $228 for the years ended December 31, 2002, 2001 and 2000, respectively.
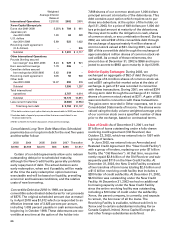
During 2002, we incurred special termination bene-
fits and recognized curtailment/settlement losses as a
result of restructuring programs.
Accordingly, the special termination benefit cost of
$29, and $18 of the total recognized settlement/curtail-
ment loss amount of $55 is included as a restructuring
charge in our Consolidated Statements of Income.
Pension plan assets consist of both defined benefit
plan assets and assets legally restricted to the TRA
accounts. The combined investment results for these
plans, along with the results for our other defined
benefit plans, are shown above in the actual return
on plan assets caption. To the extent that investment
results relate to TRA, such results are charged directly
to these accounts as a component of interest cost.
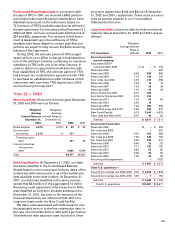
Assumed health care cost trend rates have a signifi-
cant effect on the amounts reported for the health care
plans. For measurement purposes, a 13.8 percent
annual rate of increase in the per capita cost of covered
health care benefits was assumed for 2003, decreasing
gradually to 5.2 percent in 2008 and thereafter.
A one-percentage-point change in assumed health
care cost trend rates would have the following effects:
One-percentage- One-percentage-
point increase point decrease
Effect on total service and
interest cost components $ 5 $ (4)
Effect on post-retirement
benefit obligation $64 $(54)
Employee Stock Ownership Plan (“ESOP”) Benefits:
In 1989, we established an ESOP and sold to it 10 mil-
lion shares of Series B Convertible Preferred Stock
(“Convertible Preferred”) of the Company for a
purchase price of $785. Each ESOP share is presently
convertible into six common shares of our common
stock (the “Convertible Preferred”). The Convertible
Preferred has a $1 par value and a guaranteed minimum
value of $78.25 per share and accrues annual dividends
of $6.25 per share, which are cumulative if earned.
When the ESOP was established, the ESOP borrowed
the purchase price from a group of lenders. The ESOP
debt was included in our Consolidated Balance Sheets
as debt because we guaranteed the ESOP borrowings.
and interest credits during an employee’s work life, or
(iii) the individual account balance from the Company’s
prior defined contribution plan (Transitional Retirement
Account or TRA).
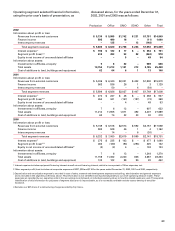
Pension Benefits Other Benefits
2002 2001 2000 2002 2001 2000
Weighted average assumptions as of December 31
Discount rate 6.2% 6.8% 7.0% 6.5% 7.2% 7.5%
Expected return on plan assets 8.8 8.9 8.9
Rate of compensation increase 3.9 3.8 3.8
72