Xerox 2002 Annual Report Download - page 26
Download and view the complete annual report
Please find page 26 of the 2002 Xerox annual report below. You can navigate through the pages in the report by either clicking on the pages listed below, or by using the keyword search tool below to find specific information within the annual report.-
 1
1 -
2
-
3
-
4
-
5
-
6
-
7
-
8
-
9
-
10
-
11
-
12
-
13
-
14
-
15
-
 16
16 -
 17
17 -
 18
18 -
 19
19 -
 20
20 -
 21
21 -
 22
22 -
 23
23 -
 24
24 -
 25
25 -
 26
26 -
 27
27 -
 28
28 -
 29
29 -
 30
30 -
 31
31 -
 32
32 -
 33
33 -
 34
34 -
 35
35 -
 36
36 -
37
-
38
-
39
-
40
-
41
-
42
-
43
-
44
-
45
-
46
-
47
-
48
-
49
-
50
-
51
-
52
-
53
-
54
-
55
-
56
-
57
-
58
-
59
-
60
-
61
-
62
-
63
-
64
-
65
-
66
-
67
-
68
-
69
-
70
-
71
-
72
-
73
-
74
-
75
-
76
-
77
-
78
-
79
-
80
-
81
-
82
-
83
-
84
-
85
-
86
-
87
-
88
-
89
-
90
-
91
-
92
-
93
-
94
-
95
-
96
-
97
-
98
-
99
-
100
 |
 |

Acquisitions: In January 2000, we acquired the Color
Printing and Imaging Division of Tektronix, Inc.
(“CPID”) for $907 million in cash, net of an $18 million
purchase price adjustment received in 2001, including
$73 million paid by Fuji Xerox for the Asia/Pacific oper-
ations. CPID manufactures and sells color printers, ink
and related products and supplies. At that time, the
acquisition accelerated us to the number two market
position in office color printing, improved our reseller
and dealer distribution network and provided us with
scalable solid ink technology. The acquisition also
enabled significant product development and expense
synergies with our monochrome printer organization.
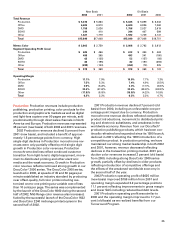
Business Performance by Segment:
Our reportable segments are consistent with how we
manage the business and how we view the markets
we serve. Our reportable segments are as follows:
Production, Office, DMO, SOHO, and Other. The table
below summarizes our business performance by
operating segment for the three-year period ended
December 31, 2002. Revenues and associated per-
centage changes, along with operating profits and
margins by segment are included. Segment operating
profit (loss) excludes certain non-segment items, such
as restructuring charges and gains on sales of busi-
nesses, as further described in Note 9 to the
Consolidated Financial Statements where we present
a reconciliation of segment profit/(loss) to pre-tax
profit (loss) as presented in our Consolidated
Statements of Income.
Operating segment information for 2001 has been
adjusted to reflect a change in operating segment
structure that was made in 2002. The nature of the
changes related primarily to corporate expense and
other allocations associated with internal reorganiza-
tions made in 2002, as well as decisions concerning
direct applicability of certain overhead expenses to the
segments. The adjustments increased (decreased) full
year 2001 revenues as follows: Production – ($16 mil-
lion), Office – ($16 million), DMO – ($1 million), SOHO
– $3 million and Other – $30 million. The full year 2001
segment profit was increased (decreased) as follows:
Production – $12 million, Office – $24 million, DMO –
$32 million, SOHO – $2 million and Other – ($70 mil-
lion). The operating segment information for 2000 has
not been restated, as it was impracticable to do so.
Therefore, we have presented 2002 and 2001 on the
new basis and 2002, 2001 and 2000 on the old basis.
24
well as recurring losses in certain jurisdictions where
we are not providing tax benefits.
The difference between the 2001 effective tax rate
and the U.S. federal statutory income tax rate, relates
primarily to the recognition of deferred tax asset valua-
tion allowances of $247 million from our recoverability
assessments, the taxes incurred in connection with the
sale of our partial interest in Fuji Xerox and recurring
losses in low tax jurisdictions. The gain for tax purpos-
es on the sale of Fuji Xerox was disproportionate to the
gain for book purposes as a result of a lower tax basis
in the investment. Other items favorably impacting the
tax rate included a tax audit resolution of approximate-
ly $140 million and additional tax benefits arising from
prior period restructuring provisions.
The difference between the 2000 effective tax rate
and the U.S. federal statutory income tax rate, relates
primarily to recurring losses in low tax jurisdictions, the
recognition of deferred tax asset valuation allowances
resulting from our recoverability assessments, as offset
by $125 million of additional tax benefits arising from
the favorable resolution of tax audits.
Our effective tax rate will change based on nonre-
curring events (such as new restructuring actions) as
well as recurring factors including the geographical
mix of income before taxes. We expect our 2003 con-
solidated effective tax rate will approximate 40 percent.
Equity in Net Income of Unconsolidated Affiliates:
Equity in net income of unconsolidated affiliates is prin-
cipally related to our 25 percent share of Fuji Xerox
income, subsequent to our sale of 25 percent of Fuji
Xerox in March 2001. Equity in net income in 2002 of
$54 million was in line with our 2001 result of $53 mil-
lion, as compared with $66 million in 2000. The 2000
results primarily reflected our 50 percent ownership
share in Fuji Xerox, partially offset by our $37 million
share of a restructuring charge recorded by Fuji Xerox.
Minorities’ Interest in Earnings of Subsidiaries:
Minorities’ interest in earnings of subsidiaries
includes the minority share of subsidiaries that we do
not own, as well as dividends on our preferred securi-
ties. The increase of $50 million in 2002 to $92 million
from 2001, primarily related to a full year of the quar-
terly distributions on the Convertible Trust Preferred
Securities, issued in November 2001, as more fully
discussed in Note 16 to the Consolidated Financial
Statements.