Xerox 2002 Annual Report Download - page 91
Download and view the complete annual report
Please find page 91 of the 2002 Xerox annual report below. You can navigate through the pages in the report by either clicking on the pages listed below, or by using the keyword search tool below to find specific information within the annual report.-
 1
1 -
2
-
3
-
4
-
5
-
6
-
7
-
8
-
9
-
10
-
11
-
12
-
13
-
14
-
15
-
16
-
17
-
18
-
19
-
20
-
21
-
22
-
23
-
24
-
25
-
26
-
27
-
28
-
29
-
30
-
31
-
32
-
33
-
34
-
35
-
36
-
37
-
38
-
39
-
40
-
41
-
42
-
43
-
44
-
45
-
46
-
47
-
48
-
49
-
50
-
51
-
52
-
53
-
54
-
55
-
56
-
57
-
58
-
59
-
60
-
61
-
62
-
63
-
64
-
65
-
66
-
67
-
68
-
69
-
70
-
71
-
72
-
73
-
74
-
75
-
76
-
77
-
78
-
79
-
80
-
 81
81 -
 82
82 -
 83
83 -
 84
84 -
 85
85 -
 86
86 -
 87
87 -
 88
88 -
 89
89 -
 90
90 -
 91
91 -
 92
92 -
 93
93 -
 94
94 -
 95
95 -
 96
96 -
 97
97 -
 98
98 -
 99
99 -
 100
100
 |
 |

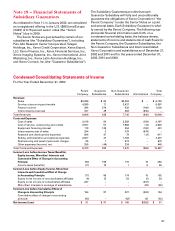
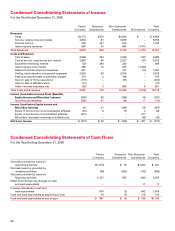
Condensed Consolidating Statements of Income
For the Year Ended December 31, 2001
Parent Guarantor Non-Guarantor Total
Company Subsidiaries Subsidiaries Eliminations Company
Revenues
Sales $3,765 $213 $ 3,465 $ – $ 7,443
Service, outsourcing and rentals 4,783 70 3,583 – 8,436
Finance income 248 400 481 – 1,129
Intercompany revenues 386 9 1,082 (1,477) –
Total Revenues 9,182 692 8,611 (1,477) 17,008
Costs and Expenses
Cost of sales 2,429 198 2,696 (153) 5,170
Cost of service, outsourcing and rentals 2,716 73 2,112 (21) 4,880
Equipment financing interest (60) 314 203 – 457
Intercompany cost of sales 344 8 921 (1,273) –
Research and development expenses 930 – 80 (13) 997
Selling, administrative and general expenses 2,664 53 2,011 – 4,728
Restructuring and asset impairment charges 329 – 386 – 715
Gain on sale of half of interest in Fuji Xerox 26 – (799) – (773)
Gain on affiliate’s sale of stock (4) – – – (4)
Other (income) expenses, net (62) (31) 537 – 444
Total Costs and Expenses 9,312 615 8,147 (1,460) 16,614
Income (Loss) before Income Taxes (Benefits),
Equity Income, Minorities’ Interests and
Cumulative Effect of Change in
Accounting Principle (130) 77 464 (17) 394
Income taxes (benefits) (129) 45 588 (7) 497
Income (Loss) before Equity Income, Minorities’
Interests and Cumulative Effect of Change
in Accounting Principle (1) 32 (124) (10) (103)
Equity in net income of unconsolidated affiliates (7) 10 46 4 53
Equity in net income of consolidated affiliates (84) – – 84 –
Minorities’ interests in earnings of subsidiaries – – – (42) (42)
Income (Loss) before Cumulative Effect of
Change in Accounting Principle (92) 42 (78) 36 (92)
Cumulative effect of change in accounting principle (2) (3) – 3 (2)
Net Income (Loss) $ (94) $ 39 $ (78) $ 39 $ (94)
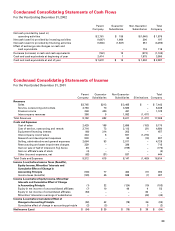
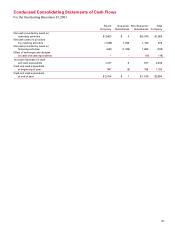
Condensed Consolidating Statements of Cash Flows
For the Year Ending December 31, 2002
Parent Guarantor Non-Guarantor Total
Company Subsidiaries Subsidiaries Company
Net cash provided by (used in)
operating activities $ 2,761 $ 155 $(1,040) $ 1,876
Net cash (used in) provided by investing activities (1,667) 1,664 200 197
Net cash (used in) provided by financing activities (1,836) (1,807) 351 (3,292)
Effect of exchange rate changes on cash and
cash equivalents – – 116 116
Decrease (increase) in cash and cash equivalents (742) 12 (373) (1,103)
Cash and cash equivalents at beginning of year 2,414 1 1,575 3,990
Cash and cash equivalents at end of year $ 1,672 $ 13 $ 1,202 $ 2,887
89