Xerox 2002 Annual Report Download - page 94
Download and view the complete annual report
Please find page 94 of the 2002 Xerox annual report below. You can navigate through the pages in the report by either clicking on the pages listed below, or by using the keyword search tool below to find specific information within the annual report.-
 1
1 -
2
-
3
-
4
-
5
-
6
-
7
-
8
-
9
-
10
-
11
-
12
-
13
-
14
-
15
-
16
-
17
-
18
-
19
-
20
-
21
-
22
-
23
-
24
-
25
-
26
-
27
-
28
-
29
-
30
-
31
-
32
-
33
-
34
-
35
-
36
-
37
-
38
-
39
-
40
-
41
-
42
-
43
-
44
-
45
-
46
-
47
-
48
-
49
-
50
-
51
-
52
-
53
-
54
-
55
-
56
-
57
-
58
-
59
-
60
-
61
-
62
-
63
-
64
-
65
-
66
-
67
-
68
-
69
-
70
-
71
-
72
-
73
-
74
-
75
-
76
-
77
-
78
-
79
-
80
-
81
-
82
-
83
-
 84
84 -
 85
85 -
 86
86 -
 87
87 -
 88
88 -
 89
89 -
 90
90 -
 91
91 -
 92
92 -
 93
93 -
 94
94 -
 95
95 -
 96
96 -
 97
97 -
 98
98 -
 99
99 -
 100
100
 |
 |

92
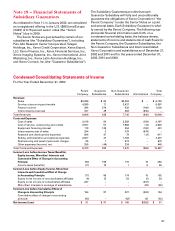
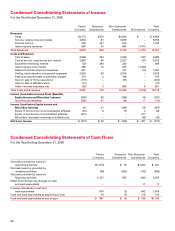
Condensed Consolidating Statements of Income
For the Year Ended December 31, 2000
Parent Guarantor Non-Guarantor Total
Company Subsidiaries Subsidiaries Eliminations Company
Revenues
Sales $4,173 $272 $4,394 $ – $ 8,839
Service, outsourcing and rentals 4,834 81 3,835 – 8,750
Finance income 205 441 516 – 1,162
Intercompany revenues 467 10 994 (1,471) –
Total Revenues 9,679 804 9,739 (1,471) 18,751
Costs and Expenses
Cost of sales 2,628 254 3,345 (147) 6,080
Cost of service, outsourcing and rentals 2,863 84 2,227 (21) 5,153
Equipment financing interest (22) 290 230 – 498
Intercompany cost of sales 455 10 875 (1,340) –
Research and development expenses 951 – 127 (14) 1,064
Selling, administrative and general expenses 2,930 69 2,519 – 5,518
Restructuring and asset impairment charges 274 3 198 – 475
Gain on sale of China operations (119) – (81) – (200)
Gain on sale of affiliate’s stock (21) – – – (21)
Other (income) expenses, net (52) 2 595 6 551
Total Costs and Expenses 9,887 712 10,035 (1,516) 19,118
Income (Loss) before Income Taxes (Benefits),
Equity Income and Minorities’ Interests (208) 92 (296) 45 (367)
Income taxes (benefits) (236) 61 88 17 (70)
Income (Loss) before Equity Income and
Minorities’ Interests 28 31 (384) 28 (297)
Equity in net income of unconsolidated affiliates (24) 8 78 4 66
Equity in net income of consolidated affiliates (277) – – 277 –
Minorities’ interests in earnings of subsidiaries – – – (42) (42)
Net (Loss) Income $ (273) $ 39 $ (306) $ 267 $ (273)
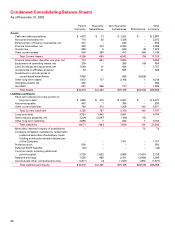
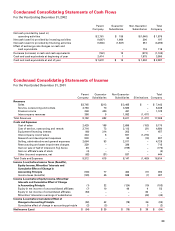
Condensed Consolidating Statements of Cash Flows
For the Year Ending December 31, 2000
Parent Guarantor Non-Guarantor Total
Company Subsidiaries Subsidiaries Company
Net cash provided by (used in)
operating activities $(1,073) $ 76 $1,204 $ 207
Net cash (used in) provided by
investing activities (99) (624) (132) (855)
Net cash provided by (used in)
financing activities 2,151 545 (441) 2,255
Effect of exchange rate changes on cash
and cash equivalents – – 11 11
Increase (decrease) in cash and
cash equivalents 979 (3) 642 1,618
Cash and cash equivalents at beginning of year 18 (2) 116 132
Cash and cash equivalents at end of year $ 997 $ (5) $ 758 $1,750