Xerox 2002 Annual Report Download - page 30
Download and view the complete annual report
Please find page 30 of the 2002 Xerox annual report below. You can navigate through the pages in the report by either clicking on the pages listed below, or by using the keyword search tool below to find specific information within the annual report.
28
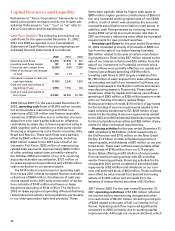
Capital Resources and Liquidity:
References to “Xerox Corporation” below refer to the
stand-alone parent company and do not include sub-
sidiaries. References to “we,” “our” or “us” refer to
Xerox Corporation and its subsidiaries.
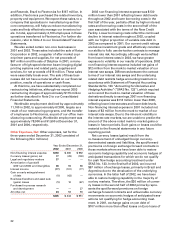
Cash Flow Analysis: The following summarizes our
cash flows for the years ended December 31, 2002,
2001 and 2000 as reported in our Consolidated
Statement of Cash Flows in the accompanying con-
solidated financial statements ($ in millions):
2002 2001 2000
Operating cash flows $ 1,876 $1,566 $ 207
Investing cash flows (usage) 197 873 (855)
Financing cash (usage) flows (3,292) (189) 2,255
Effect of exchange rate changes
on cash 116 (10) 11
(Decrease) increase in cash and
cash equivalents (1,103) 2,240 1,618
Cash and cash equivalents at
beginning of year 3,990 1,750 132
Cash and cash equivalents at
end of year $ 2,887 $3,990 $1,750
2002 Versus 2001: For the year ended December 31,
2002, operating cash flows of $1,876 million include
net income before restructuring and other non-
cash items of $2,124 million and finance receivable
reductions of $754 million due to collection of receiv-
ables from prior year’s sales without an offsetting
receivables increase due to lower equipment sales in
2002, together with a transition to third-party vendor
financing arrangements in the Nordic countries, Italy,
Brazil and Mexico. These cash flows were partially
offset by $442 million of tax payments, including
$346 million related to the 2001 sale of half of our
interest in Fuji Xerox, $392 million of restructuring
related cash payments, approximately $300 million
of other working capital uses, primarily related to
the October 2002 termination of our U.S. revolving
accounts receivable securitization, $127 million of
on-lease equipment expenditures and a $138 million
cash contribution to our pension plans.
The $310 million improvement in operating cash
flow versus 2001 reflects increased finance receivable
collections of $666 million, the absence of cash pay-
ments related to the 2001 early termination of deriva-
tive contracts of $148 million and lower on lease
equipment spending of $144 million. The decline in
2002 on lease equipment spending reflected declining
rental placement activity and populations, particularly
in our older-generation light-lens products. These
items were partially offset by higher cash taxes of
$385 million, higher pension contributions of $96 mil-
lion and increased working capital uses of over $300
million, much of which was caused by the accounts
receivable securitization termination noted above. In
addition, cash flow generated by reducing inventory
during 2002 occurred at a much slower rate than in
2001 as inventory reductions were offset by increased
requirements for new product launches.
Investing cash flows for the year ended December
31, 2002 consisted primarily of proceeds of $200 mil-
lion from the sale of our Italian leasing business,
$53 million related to the sale of certain manufactur-
ing locations to Flextronics, $67 million related to the
sale of our interest in Katun and $19 million from the
sale of our investment in Prudential common stock.
These inflows were partially offset by our capital and
internal use software spending of $196 million.
Investing cash flows in 2001 largely consisted of the
$1,768 million of cash received from sales of business-
es, including one half of our interest in Fuji Xerox, our
leasing businesses in the Nordic countries and certain
manufacturing assets to Flextronics. These cash pro-
ceeds were offset by capital and internal use software
spending of $343 million, a $255 million payment relat-
ed to our funding of trusts to replace Ridge
Reinsurance letters of credit, $115 million of payments
for the funding of escrow requirements related to the
lease contracts transferred to GE, $229 million of pay-
ments for the funding of escrow requirements related
to the 2002 and 2003 scheduled distribution payments
for the trust preferred securities and $29 million of pay-
ments for other contractual requirements.
Financing activities for the year ended December 31,
2002 consisted of $2.8 billion of debt repayments on
the Old Revolver and $710 million on the New Credit
Facility, $1.9 billion of other scheduled payments of
maturing debt, and dividends of $67 million on our pre-
ferred stock. These cash outflows were partially offset
by proceeds of $746 million from our 9.75 percent
Senior Notes offering and $1.4 billion of net proceeds
from secured borrowing activity with GE and other
vendor financing partners. Financing activities for the
comparable 2001 period consisted of scheduled debt
repayments of $2.4 billion and dividends on our com-
mon and preferred stock of $93 million. These outflows
were offset by net proceeds from secured borrowing
activity of $1,350 million and proceeds from the
issuance of trust preferred securities of $1.0 billion.
2001 Versus 2000: For the year ended December 31,
2001 operating cash flows of $1,566 million reflected
net income before restructuring charges and other
non-cash items of $2,312 million (including a net gain
of $304 related to the sale of half our interest in Fuji
Xerox). Operating cash flow improved significantly
compared to 2000, primarily due to working capital
improvements. Although our revenue declined, which


