Xerox 2002 Annual Report Download - page 31
Download and view the complete annual report
Please find page 31 of the 2002 Xerox annual report below. You can navigate through the pages in the report by either clicking on the pages listed below, or by using the keyword search tool below to find specific information within the annual report.-
 1
1 -
2
-
3
-
4
-
5
-
6
-
7
-
8
-
9
-
10
-
11
-
12
-
13
-
14
-
15
-
16
-
17
-
18
-
19
-
20
-
 21
21 -
 22
22 -
 23
23 -
 24
24 -
 25
25 -
 26
26 -
 27
27 -
 28
28 -
 29
29 -
 30
30 -
 31
31 -
 32
32 -
 33
33 -
 34
34 -
 35
35 -
 36
36 -
 37
37 -
 38
38 -
 39
39 -
 40
40 -
 41
41 -
42
-
43
-
44
-
45
-
46
-
47
-
48
-
49
-
50
-
51
-
52
-
53
-
54
-
55
-
56
-
57
-
58
-
59
-
60
-
61
-
62
-
63
-
64
-
65
-
66
-
67
-
68
-
69
-
70
-
71
-
72
-
73
-
74
-
75
-
76
-
77
-
78
-
79
-
80
-
81
-
82
-
83
-
84
-
85
-
86
-
87
-
88
-
89
-
90
-
91
-
92
-
93
-
94
-
95
-
96
-
97
-
98
-
99
-
100
 |
 |

29
normally leads to a reduction in receivables and
payables balances, our collections of receivables
exceeded our payments on accounts payable and
other current liability accounts by approximately
$500 million. We reduced our inventory balances and
spending for on-lease equipment by approximately
$480 million. We also had a one-year benefit of
approximately $350 million associated with the timing
of taxes due on the gain from our sale of half our
interest of Fuji Xerox, which we did not have to pay
until first quarter 2002. The overall impact of our
reported net loss on our operating cash flows, after
considering the impacts of non-cash items associated
with restructuring charges, provisions, tax valuation
allowances and gains did not vary significantly
between 2001 and 2000.
Investing cash flows were higher in 2001 primarily
due to $1,768 million of cash received from the sales
of businesses, including Fuji Xerox and our leasing
businesses in the Nordic countries. These cash pro-
ceeds were greater than the $640 million received
from the sale of businesses in 2000. In 2001 we also
reduced capital spending and internal-use software
spending significantly. Other factors contributing to
the 2001 improvement were the acquisition of CPID in
2000, which utilized cash of $856 million, while in
2001 we were required to fund $628 million of certain
escrow and insurance trusts based on contractual
requirements.
Our 2001 financing cash flows largely consisted of
a net repayment of approximately $1.1 billion of debt,
offset by a private placement of $1.0 billion of trust
preferred securities. The suspension of dividends on
our common and preferred stock also positively
impacted our cash flows in 2001. 2000 financing activ-
ities consisted of net borrowing of $2.9 billion, which
funded the CPID acquisition and increased our cash
balance, partially offset by common and preferred
stock dividends of $587 million.
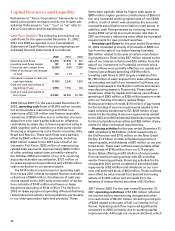
Capital Structure and Liquidity: Historically, we have
provided equipment financing to a significant majori-
ty of our customers. Because the finance leases allow
our customers to pay for equipment over time rather
than at the date of purchase, we have needed to
maintain significant levels of debt to provide operat-
ing liquidity, as liquidity generated from receivable
collections has generally been used to fund new
equipment leases. A significant portion of our debt is
directly related to the funding requirements of our
financing business.
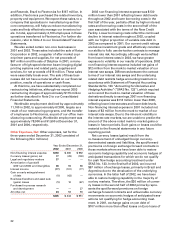
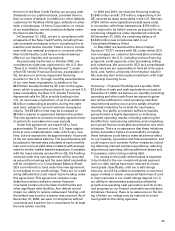
During the years ended December 31, 2002 and
2001, we originated loans, secured by finance receiv-
ables, with cash proceeds of $3,055 million and
$2,418 million, respectively. Approximately half of our
total finance receivable portfolio has been securitized
at December 31, 2002 compared with 24 percent a
year earlier. We expect to increase the proportion of
our finance receivables which are securitized to
approximately 60 percent by the end of 2004. The
following table compares finance receivables to
financing-related debt as of December 31, 2002 ($ in
millions):
Finance
Receivables Debt(2)
Finance Receivables Encumbered
by Loans(1):
GE Loans – U.S. and Canada $ 2,777 $ 2,642
Merrill Lynch Loan – France 413 377
U.S. Asset-backed notes 247 139
XCC securitizations 101 7
Subtotal – Special Purpose Entities 3,538 3,165
GE Loans – UK 691 529
GE Loans – Other Europe 95 95
Other Europe 113 111
Total 4,437 $ 3,900
Unencumbered Finance
Receivables 4,568
Total Finance Receivables(3) $ 9,005
(1) Encumbered finance receivables represent the book value of finance
receivables that secure each of the indicated loans.
(2) Represents the debt secured by finance receivables, including transac-
tions utilizing special purpose entities, which are described below.
(3) Includes (i) Billed portion of finance receivables, net (ii) Finance receiv-
ables, net and (iii) Finance receivables due after one year, net as included
in the consolidated balance sheets as of December 31, 2002.
As of December 31, 2002, debt secured by finance
receivables was approximately 28 percent of total
debt. As we increase the proportion of our finance
receivables that are securitized, we expect this per-
centage to increase to approximately 40 percent by
the end of 2004.
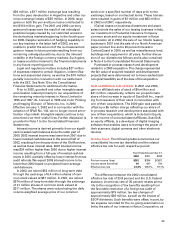
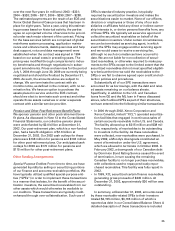
The following represents our aggregate debt matu-
rity schedule ($ in millions):
2003 2004 2005 2006 Thereafter
First Quarter $ 626 $ 992
Second Quarter 1,315 907
Third Quarter 658 910
Fourth Quarter 1,778 1,100
Full Year $4,377 $3,909 $4,016 $56 $1,813
Of the full year amounts shown in the above table,
$1,887 million and $1,426 million for 2003 and 2004,
respectively, relate to debt secured by finance receiv-
ables. For a discussion on the contractual maturities
of our mandatorily redeemable preferred securities,
refer to the section entitled “Contractual Cash
Obligations and Other Commercial Commitments
and Contingencies.”