Xerox 2002 Annual Report Download - page 22
Download and view the complete annual report
Please find page 22 of the 2002 Xerox annual report below. You can navigate through the pages in the report by either clicking on the pages listed below, or by using the keyword search tool below to find specific information within the annual report.-
 1
1 -
2
-
3
-
4
-
5
-
6
-
7
-
8
-
9
-
10
-
11
-
 12
12 -
 13
13 -
 14
14 -
 15
15 -
 16
16 -
 17
17 -
 18
18 -
 19
19 -
 20
20 -
 21
21 -
 22
22 -
 23
23 -
 24
24 -
 25
25 -
 26
26 -
 27
27 -
 28
28 -
 29
29 -
 30
30 -
 31
31 -
 32
32 -
33
-
34
-
35
-
36
-
37
-
38
-
39
-
40
-
41
-
42
-
43
-
44
-
45
-
46
-
47
-
48
-
49
-
50
-
51
-
52
-
53
-
54
-
55
-
56
-
57
-
58
-
59
-
60
-
61
-
62
-
63
-
64
-
65
-
66
-
67
-
68
-
69
-
70
-
71
-
72
-
73
-
74
-
75
-
76
-
77
-
78
-
79
-
80
-
81
-
82
-
83
-
84
-
85
-
86
-
87
-
88
-
89
-
90
-
91
-
92
-
93
-
94
-
95
-
96
-
97
-
98
-
99
-
100
 |
 |

20
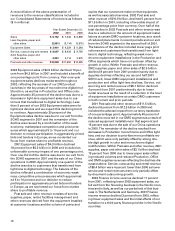
Finance income margins of approximately 60 per-
cent reflect interest expense related to our financing
operations. Equipment financing interest rates are
determined based on a combination of actual interest
expense incurred on financing debt, as well as our esti-
mated cost of funds, applied against the estimated
level of debt required to support our financed receiv-
ables. The estimate is based on an assumed ratio of
debt as compared to our finance receivables. This ratio
ranges from 80-90 percent of our average finance
receivables. This methodology has been consistently
applied for all periods presented. We expect our 2003
Finance income gross margin to be in line with 2002.
Research and Development: 2002 research and
development (“R&D”) spending of $917 million, was
$80 million lower than 2001. Approximately 40 per-
cent of the decline was due to our SOHO exit, another
40 percent of the decline reflects both benefits from
cost restructuring actions and the receipt of external
funding and the balance reflects the previously dis-
cussed favorable ESOP compensation expense
adjustment. R&D spending represented our continued
investment in technological development, particularly
color, to maintain our position in the rapidly changing
document processing market. We believe our R&D
remains technologically competitive. Our R&D is
strategically coordinated with that of Fuji Xerox,
which invested $580 million in R&D in 2002, which
together with our R&D spending resulted in a com-
bined total of $1.5 billion. To maximize the synergies
of our relationship, our R&D expenditures are focused
on the Production segment while Fuji Xerox R&D
expenditures are focused on the Office segment. In
2002, we were awarded over 700 U.S. patents ranking
us 19th on the list of companies that had been award-
ed the most U.S. patents during the year. Together
with Fuji Xerox, we were awarded close to 900 U.S.
patents in 2002. Our patent portfolio evolves as new
patents are awarded to us and as older patents expire.
As of December 31, 2002, we held approximately
7,700 U.S. patents. These patents expire at various
dates up to 17 years from the date of award. While we
believe that our portfolio of patents and applications
has value, in general no single patent is essential to
our business or the individual segments. In addition,
any of our proprietary rights could be challenged,
invalidated or circumvented, or may not provide sig-
nificant competitive advantages.
2001 R&D spending of $997 million declined by
$67 million from 2000. Over half the reduction reflects
the second half 2001 SOHO disengagement, with the
balance due to cost reduction initiatives in 2000 and
2001.
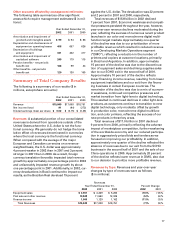
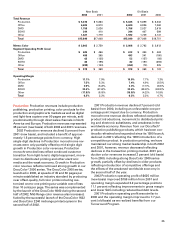
Selling, Administrative and General Expenses: Selling,
administrative and general (“SAG”) expense informa-
tion was as follows ($ in millions):
Year Ended December 31,
2002 2001 2000
Total Selling, administrative
and general expenses $4,437 $ 4,728 $ 5,518
SAG as a percentage of
revenue 28.0% 27.8% 29.1%
2002 SAG expense of $4,437 million declined by
$291 million from 2001. The reduction includes lower
bad debt expenses of $106 million, lower SOHO
spending of $84 million and a $34 million favorable
property tax adjustment in North America. These
decreases were partially offset by $106 million of
internal-use software impairment charges, $65 million
of higher advertising and marketing communications
spending, $18 million of increased professional fees
and $26 million of losses associated with the exit from
certain leased facilities. The balance of the reduction
primarily reflects employment reductions associated
with our cost base restructuring which has resulted in
lower labor, benefit and related expenses.
2001 SAG expense of $4,728 million declined
$790 million from 2000 reflecting significantly lower
labor costs and other benefits derived from our cost
reduction initiatives, temporarily lower advertising and
marketing communications spending of $88 million and
reduced SOHO spending of $62 million, partially offset
by increased professional costs related to litigation,
regulatory issues and related matters of $52 million.
We expect 2003 total SAG expense reductions in
line with the 2002 decline.
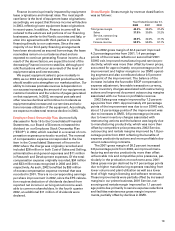
Bad debt expense included in SAG, was $332 mil-
lion, $438 million and $472 million in 2002, 2001 and
2000, respectively. Lower expense in 2002 is due to
improved customer administration, collection prac-
tices and credit approval policies, as well as our rev-
enue declines. 2001 provisions were lower than 2000
due to lower equipment sales, partially offset by
reserve increases due to the weakened worldwide
economy. Bad debt expenses as a percent of total rev-
enue were 2.1 percent, 2.6 percent, and 2.5 percent for
2002, 2001 and 2000, respectively.
As with Finance income, the bad debt provision will
be impacted to the extent we sell portions of our
financing businesses, including existing receivables,
or enter into agreements with third parties to provide
financing directly to our customers. Any provision for
customer credit would accordingly be factored in the
proceeds we receive from the counterparty and the
resultant revenue or gain recognized on the sale of
equipment or receivables. However, as noted above,
since most of our transactions with third parties
involve secured borrowing structures, the associated