Xerox 2002 Annual Report Download - page 19
Download and view the complete annual report
Please find page 19 of the 2002 Xerox annual report below. You can navigate through the pages in the report by either clicking on the pages listed below, or by using the keyword search tool below to find specific information within the annual report.-
 1
1 -
2
-
3
-
4
-
5
-
6
-
7
-
8
-
 9
9 -
 10
10 -
 11
11 -
 12
12 -
 13
13 -
 14
14 -
 15
15 -
 16
16 -
 17
17 -
 18
18 -
 19
19 -
 20
20 -
 21
21 -
 22
22 -
 23
23 -
 24
24 -
 25
25 -
 26
26 -
 27
27 -
 28
28 -
 29
29 -
30
-
31
-
32
-
33
-
34
-
35
-
36
-
37
-
38
-
39
-
40
-
41
-
42
-
43
-
44
-
45
-
46
-
47
-
48
-
49
-
50
-
51
-
52
-
53
-
54
-
55
-
56
-
57
-
58
-
59
-
60
-
61
-
62
-
63
-
64
-
65
-
66
-
67
-
68
-
69
-
70
-
71
-
72
-
73
-
74
-
75
-
76
-
77
-
78
-
79
-
80
-
81
-
82
-
83
-
84
-
85
-
86
-
87
-
88
-
89
-
90
-
91
-
92
-
93
-
94
-
95
-
96
-
97
-
98
-
99
-
100
 |
 |

17
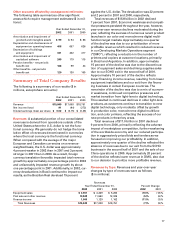
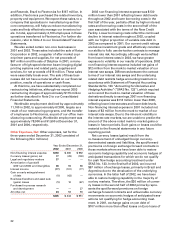
Other accounts affected by management estimates:
The following table summarizes other significant
areas which require management estimates ($ in mil-
lions):
Year Ended December 31,
2002 2001 2000
Amortization and impairment of
goodwill and intangible assets $ 99 $ 94 $ 86
Depreciation and obsolescence of
equipment on operating leases 408 657 626
Depreciation of buildings
and equipment 341 402 417
Amortization and impairment of
capitalized software 249 179 115
Pension benefits – net periodic
benefit cost 168 99 44
Other benefits – net periodic
benefit cost 120 130 109
Summary of Total Company Results:
The following is a summary of our results ($ in
millions, except share amounts):
Year Ended December 31,
2002 2001 2000
Revenue $15,849 $17,008 $18,751
Net income (loss) 91 (94) (273)
Diluted earnings (loss) per share $ 0.02 $ (0.15) $ (0.48)
Revenues: A substantial portion of our consolidated
revenues is derived from operations outside of the
United States where the U.S. dollar is not the func-
tional currency. We generally do not hedge the trans-
lation effect of revenues denominated in currencies
where the local currency is the functional currency.
When compared with the average of the major
European and Canadian currencies on a revenue-
weighted basis, the U.S. dollar was approximately
4 percent weaker in 2002 than in 2001 and 3 percent
stronger in 2001 than in 2000. As a result, foreign
currency translation favorably impacted total revenue
growth by approximately one percentage point in 2002
and unfavorably impacted revenue growth by about
one percentage point in 2001. Additionally, in 2002, cur-
rency devaluations in Brazil continued to impact our
results, as the Brazilian Real devalued 19 percent
against the U.S. dollar. The devaluation was 22 percent
and 2 percent in 2001 and 2000, respectively.
Total revenues of $15.8 billion in 2002 declined
7 percent from 2001. Economic weakness and competi-
tive pressures persisted throughout the year, however,
year-over-year revenue declines moderated during the
year, reflecting the success of numerous recent product
launches in our color and monochrome digital multi-
function target markets. Approximately one quarter
of the decline was due to our prioritization of more
profitable revenue which resulted in reduced revenue
in our Developing Markets Operations segment
(“DMO”), reflecting a reduction in the number of
printers and copiers at customer locations, primarily
in Brazil and Argentina. In addition, approximately
15 percent of the decline was due to the discontinua-
tion of equipment sales and declining supplies sales
due to our SOHO exit in the second half of 2001.
Approximately 10 percent of the decline reflects
lower financing income revenue, resulting from lower
equipment installations and our exit from the financ-
ing business in certain European countries. The
remainder of the decline was due to a mix of econom-
ic weakness, continued competitive pressures and
market transition from light-lens to digital technology.
This resulted in continued declines in older light-lens
products, as customers continue to transition to new
digital technology, only modestly offset by growth
in production color, monochrome digital multifunc-
tion, and color printers, reflecting the success of our
new products in these key areas.
Total revenues of $17.0 billion in 2001 declined
9 percent from 2000, primarily reflecting the adverse
impact of marketplace competition, further weakening
of the worldwide economy and our reduced participa-
tion in aggressively priced bids and tenders as we
focused on improving our profitability. In addition,
approximately one quarter of the decline reflected the
absence of revenues due to our exit from the SOHO
business in the second half of 2001 and the sale of our
China operations in 2000. Approximately 20 percent
of the decline reflects lower revenue in DMO, also due
to our decision to prioritize more profitable revenue.
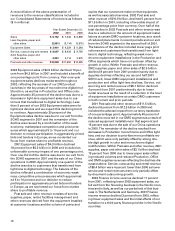
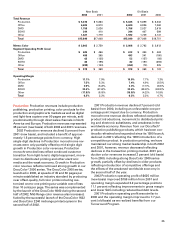
Revenues by Type: Revenues and year-over-year
changes by type of revenues were as follows
($ in millions):
Revenues
Year Ended December 31, Percent Change
2002 2001 2000 2002 2001
Equipment sales $ 3,901 $ 4,329 $ 5,264 (10)% (18)%
Post sale and other revenue 10,948 11,550 12,325 (5)% (6)%
Finance income 1,000 1,129 1,162 (11)% (3)%
Total Revenues $15,849 $17,008 $18,751 (7)% (9)%