Xerox 2002 Annual Report Download - page 64
Download and view the complete annual report
Please find page 64 of the 2002 Xerox annual report below. You can navigate through the pages in the report by either clicking on the pages listed below, or by using the keyword search tool below to find specific information within the annual report.-
 1
1 -
2
-
3
-
4
-
5
-
6
-
7
-
8
-
9
-
10
-
11
-
12
-
13
-
14
-
15
-
16
-
17
-
18
-
19
-
20
-
21
-
22
-
23
-
24
-
25
-
26
-
27
-
28
-
29
-
30
-
31
-
32
-
33
-
34
-
35
-
36
-
37
-
38
-
39
-
40
-
41
-
42
-
43
-
44
-
45
-
46
-
47
-
48
-
49
-
50
-
51
-
52
-
53
-
 54
54 -
 55
55 -
 56
56 -
 57
57 -
 58
58 -
 59
59 -
 60
60 -
 61
61 -
 62
62 -
 63
63 -
 64
64 -
 65
65 -
 66
66 -
 67
67 -
 68
68 -
 69
69 -
 70
70 -
 71
71 -
 72
72 -
 73
73 -
 74
74 -
75
-
76
-
77
-
78
-
79
-
80
-
81
-
82
-
83
-
84
-
85
-
86
-
87
-
88
-
89
-
90
-
91
-
92
-
93
-
94
-
95
-
96
-
97
-
98
-
99
-
100
 |
 |

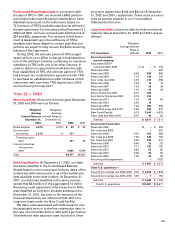
62
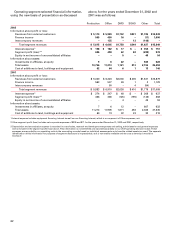
Production Office DMO SOHO Other Total
2002
Information about profit or loss:
Revenues from external customers $ 5,110 $ 5,980 $1,742 $231 $1,786 $14,849
Finance income 505 490 16 – (11) 1,000
Intercompany revenues – 135 – 13 (148) –
Total segment revenues $ 5,615 $ 6,605 $1,758 $244 $1,627 $15,849
Interest expense(1) $ 198 $ 182 $ 17 $ – $ 354 $ 751
Segment profit (loss)(2)(3) 625 498 62 82 (289) 978
Equity in net income of unconsolidated affiliates – – 5 – 49 54
Information about assets:
Investments in affiliates, at equity 9 8 22 – 589 628
Total assets 10,756 11,213 1,121 213 2,155 25,458
Cost of additions to land, buildings and equipment 62 64 6 1 13 146
2001
Information about profit or loss:
Revenues from external customers $ 5,320 $ 6,323 $2,000 $ 405 $1,831 $15,879
Finance income 563 537 26 1 2 1,129
Intercompany revenues – 50 – 4 (54) –
Total segment revenues $ 5,883 $ 6,910 $2,026 $ 410 $1,779 $17,008
Interest expense(1) $ 274 $ 247 $ 48 $ – $ 368 $ 937
Segment profit (loss)(2)(3) 466 365 (125) (195) (143) 368
Equity in net income of unconsolidated affiliates – – 4 – 49 53
Information about assets:
Investments in affiliates, at equity 7 6 12 – 607 632
Total assets 11,214 11,905 1,671 492 2,363 27,645
Cost of additions to land, buildings and equipment 60 74 32 23 30 219
1 Interest expense includes equipment financing interest as well as non-financing interest, which is a component of Other expenses, net.
2 Other segment profit (loss) includes net corporate expenses of $235 and $71 for the years ended December 31, 2002 and 2001, respectively.
3 Depreciation and amortization expense is recorded in cost of sales, research and development expenses and selling, administrative and general expenses
and is included in the segment profit (loss) above. This information is not identified and reported separately to our chief operating decision-maker. These
expenses are recorded by our operating units in the accounting records based on individual assessments as to how the related assets are used. The separate
identification of this information for purposes of segment disclosure is impracticable, as it is not readily available and the cost to develop it would be
excessive.
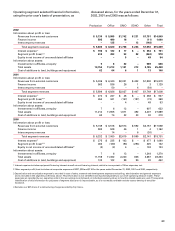
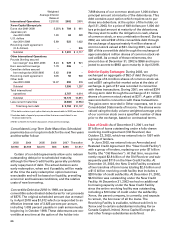
Operating segment selected financial information,
using the new basis of presentation as discussed
above, for the years ended December 31, 2002 and
2001 was as follows: