Xerox 2002 Annual Report Download - page 29
Download and view the complete annual report
Please find page 29 of the 2002 Xerox annual report below. You can navigate through the pages in the report by either clicking on the pages listed below, or by using the keyword search tool below to find specific information within the annual report.-
 1
1 -
2
-
3
-
4
-
5
-
6
-
7
-
8
-
9
-
10
-
11
-
12
-
13
-
14
-
15
-
16
-
17
-
18
-
 19
19 -
 20
20 -
 21
21 -
 22
22 -
 23
23 -
 24
24 -
 25
25 -
 26
26 -
 27
27 -
 28
28 -
 29
29 -
 30
30 -
 31
31 -
 32
32 -
 33
33 -
 34
34 -
 35
35 -
 36
36 -
 37
37 -
 38
38 -
 39
39 -
40
-
41
-
42
-
43
-
44
-
45
-
46
-
47
-
48
-
49
-
50
-
51
-
52
-
53
-
54
-
55
-
56
-
57
-
58
-
59
-
60
-
61
-
62
-
63
-
64
-
65
-
66
-
67
-
68
-
69
-
70
-
71
-
72
-
73
-
74
-
75
-
76
-
77
-
78
-
79
-
80
-
81
-
82
-
83
-
84
-
85
-
86
-
87
-
88
-
89
-
90
-
91
-
92
-
93
-
94
-
95
-
96
-
97
-
98
-
99
-
100
 |
 |

27
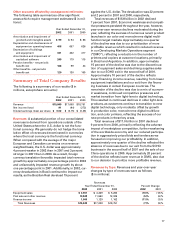
The 2001 SOHO segment loss improved by $96 mil-
lion (old basis) or 32 percent from 2000. Despite a
gross margin decline, significant SAG and R&D reduc-
tions, following our June 2001 disengagement, result-
ed in substantially lower operating losses in 2001 and
a return to profitability in the fourth quarter.
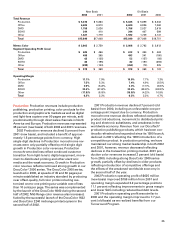
Other: Over half of the revenues in our Other segment
are derived from sales of paper, approximately, one
quarter are from Xerox Engineering Systems (“XES”),
and the remainder are derived from Xerox Connect
(“XConnect”), Xerox Technology Enterprises (“XTE”)
and other sources including consulting services, roy-
alty and license revenues. XES is a business that sells
equipment used for special engineering applications,
XConnect is a network service business aimed at opti-
mizing office efficiency and providing solutions and
XTE consists of a collection of high technology start-
up entities. The Other segment profit (loss) includes
the profit (loss) from the previously mentioned
sources, equity income received from Fuji Xerox and
certain costs which have not been allocated to the
businesses including non-financing and other corpo-
rate costs.
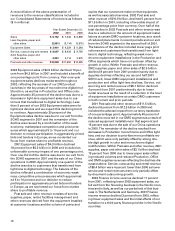
2002 Other revenues declined 9 percent (new
basis), from 2001. Approximately half of the decline
was due to lower revenues in XES and XConnect, an
additional 15 percent related to lower paper sales con-
sistent with other post sale revenue declines, partially
offset by licensing revenue and royalties. XES rev-
enue declined principally due to lower dealer equip-
ment revenue, while XConnect declines were due to a
reduced emphasis on third-party equipment installa-
tions. The remainder of the declines were consistent
with other aspects of our business.
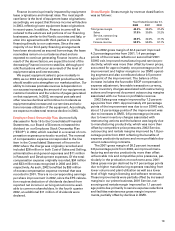
2001 Other revenues of $1,749 million (old basis)
declined 18 percent from 2000. Approximately 25 per-
cent of the revenue decline was due to lower paper
sales, consistent with our post sale declines. Another
25 percent decline was attributable to lower XTE rev-
enues due to the sale of a business in 2000, the clos-
ing of one business in 2001, and the deconsolidation
of two small investments during 2001 due to changes
in ownership structure and the resultant change to
equity accounting. XES revenue represented 20 per-
cent of the decline principally due to increased
European competition and lower post sale revenue
resulting from lower machine populations. XConnect
revenue also accounted for 20 percent of the decline
due to a decreased emphasis on third-party equip-
ment installations. The remaining decline was consis-
tent with other aspects of our business.
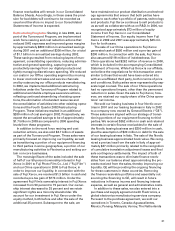
2002 Other segment loss of $289 million (new
basis), increased by $146 million from 2001, principal-
ly due to the write-off of internal use software of
$106 million, higher pension and benefit expense
of $93 million and higher advertising expenses of
$62 million. These increased costs were partially off-
set by lower non-financing interest expense of
$130 million, the $33 million beneficial year over
year impact of the ESOP expense adjustment and
the $50 million profit from licensing revenue.
The 2001 Other segment loss of $73 (old basis)
reflects additional ESOP compensation expense
necessitated by the elimination of the ESOP dividend
of $33 million, higher professional fees related to litiga-
tion and SEC issues and related matters of $52 million.
2000 results benefited from the gains on the sales of
our North American paper business of $40 million, a
25 percent interest in ContentGuard of $23 million and
a $21 million gain on our ScanSoft affiliate’s sale of
stock.
New Accounting Standards:
During 2002 and 2001, the Financial Accounting
Standards Board (“FASB”) issued several new
accounting standards which effect the recognition
and measurement and/or disclosure of business com-
binations, goodwill and intangible assets, impairment
or disposals of long-lived assets, gains on extinguish-
ment of debt, costs associated with exit or disposal
activities and stock-based compensation. We have
adopted these new standards in whole or in part, as
applicable, during the year ended December 31, 2002.
The effects of these new standards are discussed in
the relevant sections of this MD&A and in more detail
in Note 1 to the Consolidated Financial Statements.
In addition, the FASB has recently issued the fol-
lowing applicable standards and interpretations that
we have not yet adopted:
– Statement of Financial Accounting Standards
No. 143, “Accounting for Asset Retirement
Obligations” (“SFAS 143”),
– FASB Interpretation No. 45, “Guarantor’s
Accounting and Disclosure Requirements for
Guarantees, Including Indirect Guarantees of
Indebtedness of Others” (“FIN 45”),
– FASB Interpretation No. 46, “Consolidation of
Variable Interest Entities” (“FIN 46”).
We have adopted the disclosure provisions of FIN
45 and FIN 46 as of December 31, 2002. We do not
expect the adoption of SFAS No. 143, FIN 45 and FIN
46 to have a material effect on our financial position
or results of operations.