Xerox 2002 Annual Report Download - page 87
Download and view the complete annual report
Please find page 87 of the 2002 Xerox annual report below. You can navigate through the pages in the report by either clicking on the pages listed below, or by using the keyword search tool below to find specific information within the annual report.-
 1
1 -
2
-
3
-
4
-
5
-
6
-
7
-
8
-
9
-
10
-
11
-
12
-
13
-
14
-
15
-
16
-
17
-
18
-
19
-
20
-
21
-
22
-
23
-
24
-
25
-
26
-
27
-
28
-
29
-
30
-
31
-
32
-
33
-
34
-
35
-
36
-
37
-
38
-
39
-
40
-
41
-
42
-
43
-
44
-
45
-
46
-
47
-
48
-
49
-
50
-
51
-
52
-
53
-
54
-
55
-
56
-
57
-
58
-
59
-
60
-
61
-
62
-
63
-
64
-
65
-
66
-
67
-
68
-
69
-
70
-
71
-
72
-
73
-
74
-
75
-
76
-
 77
77 -
 78
78 -
 79
79 -
 80
80 -
 81
81 -
 82
82 -
 83
83 -
 84
84 -
 85
85 -
 86
86 -
 87
87 -
 88
88 -
 89
89 -
 90
90 -
 91
91 -
 92
92 -
 93
93 -
 94
94 -
 95
95 -
 96
96 -
 97
97 -
98
-
99
-
100
 |
 |

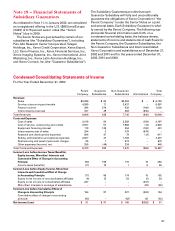
respectively. No monetary consideration is paid by
employees who receive restricted shares. Compen-
sation expense for restricted grants is based upon the
grant date market price and is recorded over the vest-
ing period which on average ranges from one to three
years. Compensation expense recorded for restricted
grants was $17, $15 and $18 in 2002, 2001 and 2000,
respectively.
Stock options and rights are settled with newly
issued or, if available, treasury shares of our common
stock. Stock options generally vest in three years and
expire between eight and ten years from the date of
grant. The exercise price of the options is equal to the
market value of our common stock on the effective
date of grant.
At December 31, 2002 and 2001, 43.2 million and
39.7 million shares, respectively, were available for
grant of options or rights. The following table provides
information relating to the status of, and changes in,
options granted:
Options Outstanding Options Exercisable
Weighted
Range of Number Average Remaining Weighted Average Number Weighted Average
Exercise Prices Outstanding Contractual Life Exercise Price Exercisable Exercise Price
$ 4.75 to $ 6.98 12,730 8.16 $ 4.85 3,983 $ 4.76
7.13 to 10.69 14,554 8.97 10.12 252 7.78
10.72 to 15.27 468 7.59 12.87 164 14.68
16.91 to 23.25 18,982 5.37 21.51 15,025 21.44
25.81 to 36.70 11,668 4.13 31.29 8,861 32.94
41.72 to 60.95 18,447 4.34 52.99 16,965 53.47
$ 4.75 to $60.95 76,849 6.09 $25.58 45,250 $34.13
Options outstanding and exercisable at December 31, 2002 were as follows:
2002 2001 2000
Average Average Average
Stock Option Stock Option Stock Option
Employee Stock Options Options Price Options Price Options Price
Outstanding at January 1 68,829 $29 58,233 $35 43,388 $42
Granted 14,286 10 15,085 5 19,338 22
Cancelled (5,668) 34 (4,479) 28 (4,423) 38
Exercised (598) 5 (10) 5 (70) 22
Outstanding at December 31 76,849 26 68,829 29 58,233 35
Exercisable at end of year 45,250 36,388 23,346
Note 18 — Earnings Per Share
Basic earnings per share is computed by dividing
income available to common shareholders (the numer-
ator) by the weighted-average number of common
shares outstanding (the denominator) for the period.
Diluted earnings per share assumes that any dilutive
convertible preferred shares, convertible subordinated
debentures, and convertible securities outstanding
were converted, with related preferred stock dividend
requirements and outstanding common shares adjust-
ed accordingly. It also assumes that outstanding com-
mon shares were increased by shares issuable upon
exercise of those stock options for which market price
exceeds the exercise price, less shares which could
have been purchased by us with the related proceeds.
In periods of losses, diluted loss per share is computed
on the same basis as basic loss per share as the inclu-
sion of any other potential shares outstanding would
be anti-dilutive.
When computing diluted EPS, we are required to
assume conversion of the ESOP preferred shares into
common stock if we are profitable. The conversion
guarantees that each ESOP preferred share be convert-
ed into shares worth a minimum value of $78.25. As
long as our common stock price is above $13.04 per
share, the conversion ratio is 6 to 1. As our share price
falls below this amount, the conversion ratio increases.
85