Xerox 2002 Annual Report Download - page 73
Download and view the complete annual report
Please find page 73 of the 2002 Xerox annual report below. You can navigate through the pages in the report by either clicking on the pages listed below, or by using the keyword search tool below to find specific information within the annual report.-
 1
1 -
2
-
3
-
4
-
5
-
6
-
7
-
8
-
9
-
10
-
11
-
12
-
13
-
14
-
15
-
16
-
17
-
18
-
19
-
20
-
21
-
22
-
23
-
24
-
25
-
26
-
27
-
28
-
29
-
30
-
31
-
32
-
33
-
34
-
35
-
36
-
37
-
38
-
39
-
40
-
41
-
42
-
43
-
44
-
45
-
46
-
47
-
48
-
49
-
50
-
51
-
52
-
53
-
54
-
55
-
56
-
57
-
58
-
59
-
60
-
61
-
62
-
 63
63 -
 64
64 -
 65
65 -
 66
66 -
 67
67 -
 68
68 -
 69
69 -
 70
70 -
 71
71 -
 72
72 -
 73
73 -
 74
74 -
 75
75 -
 76
76 -
 77
77 -
 78
78 -
 79
79 -
 80
80 -
 81
81 -
 82
82 -
 83
83 -
84
-
85
-
86
-
87
-
88
-
89
-
90
-
91
-
92
-
93
-
94
-
95
-
96
-
97
-
98
-
99
-
100
 |
 |

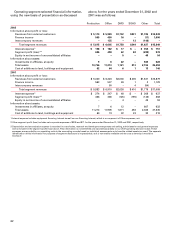
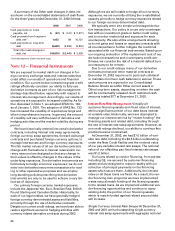
71
2002 2001
Carrying Fair Carrying Fair
Amount Value Amount Value
Cash and cash
equivalents $2,887 $2,887 $ 3,990 $3,990
Accounts receivable, net 2,072 2,072 1,896 1,896
Short-term debt 4,377 3,837 6,637 6,503
Long-term debt 9,794 9,268 10,107 9,261
The fair value amounts for Cash and cash equiva-
lents and Accounts receivable, net approximate
carrying amounts due to the short maturities of these
instruments.
The fair value of Short- and Long-term debt was
estimated based on quoted market prices for these or
similar issues or on the current rates offered to us for
debt of similar maturities. The difference between the
fair value and the carrying value represents the theo-
retical net premium or discount we would pay or
receive to retire all debt at such date. We have no
plans to retire significant portions of our debt prior
to scheduled maturity.
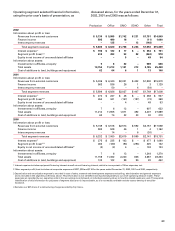
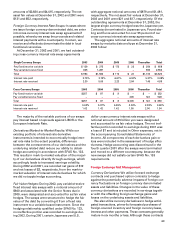
Note 13 — Employee Benefit Plans
We sponsor numerous pension and other post-retire-
ment benefit plans, primarily retiree health, in our U.S.
Pension Benefits Other Benefits
2002 2001 2002 2001
Change in Benefit Obligation
Benefit obligation, January 1 $ 7,606 $8,255 $ 1,481 $ 1,314
Service cost 180 174 26 28
Interest cost (210) (184) 96 99
Plan participants’ contributions 18 19 3–
Plan amendments (31) –(139) –
Actuarial loss 736 76 191 136
Currency exchange rate changes 327 (99) –(3)
Divestitures (1) –––
Curtailments 234 8(1)
Special termination benefits 39 –2–
Benefits paid/settlements (735) (669) (105) (92)
Benefit obligation, December 31 $ 7,931 $7,606 $ 1,563 $ 1,481
Change in Plan Assets
Fair value of plan assets, January 1 $ 7,040 $8,626 $ – $–
Actual return on plan assets (768) (843) ––
Employer contribution 138 42 102 92
Plan participants’ contributions 18 19 3–
Currency exchange rate changes 271 (135) ––
Divestitures (1) –––
Benefits paid (735) (669) (105) (92)
Fair value of plan assets, December 31 $ 5,963 $7,040 $–$ –
Funded status (including under-funded and non-funded plans) $(1,968) $ (566) $(1,563) $(1,481)
Unamortized transition assets –(1) ––
Unrecognized prior service cost (27) 8(134) (2)
Unrecognized net actuarial (gain) loss 1,843 434 445 250
Net amount recognized $ (152) $ (125) $(1,252) $(1,233)
Amounts recognized in the Consolidated Balance Sheets consist of:
Prepaid benefit cost $ 656 $ 597 $ – $ –
Accrued benefit liability (1,277) (785) (1,252) (1,233)
Intangible asset 77––
Accumulated other comprehensive income 462 56 ––
Net amount recognized $ (152) $ (125) $(1,252) $(1,233)
Under-funded or non-funded plans
Aggregate benefit obligation $ 7,865 $5,778 $ 1,563 $ 1,481
Aggregate fair value of plan assets $ 5,878 $5,039 $ – $–
Plans with under-funded or non-funded accumulated benefit obligations
Aggregate accumulated benefit obligation $ 5,188 $4,604
Aggregate fair value of plan assets $ 4,008 $4,157
and international operations. Information regarding
our benefit plans is presented below: